Cities with the Largest Bhutanese Community in Illinois
RELATED REPORTS & OPTIONS
Bhutanese
Illinois
Compare Cities
Map of Cities with the Largest Bhutanese Community in Illinois
0
10,000
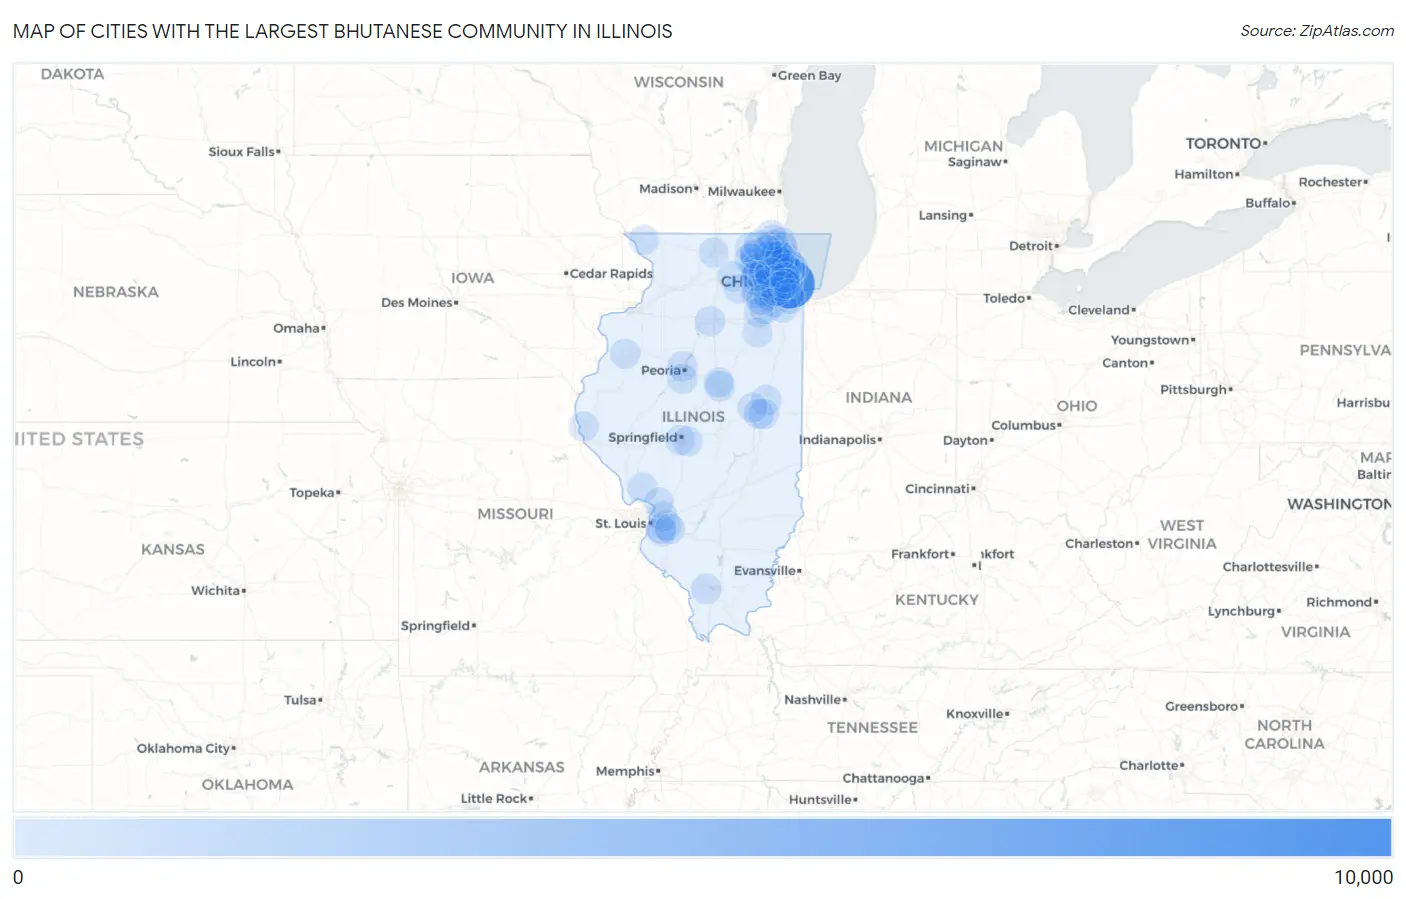
Cities with the Largest Bhutanese Community in Illinois
| City | Bhutanese | vs State | vs National | |
| 1. | Chicago | 9,659 | 35,296(27.37%)#1 | 1,614,103(0.60%)#16 |
| 2. | Schaumburg | 2,012 | 35,296(5.70%)#2 | 1,614,103(0.12%)#104 |
| 3. | Hoffman Estates | 1,140 | 35,296(3.23%)#3 | 1,614,103(0.07%)#208 |
| 4. | Arlington Heights | 891 | 35,296(2.52%)#4 | 1,614,103(0.06%)#276 |
| 5. | Oak Park | 707 | 35,296(2.00%)#5 | 1,614,103(0.04%)#355 |
| 6. | Evanston | 697 | 35,296(1.97%)#6 | 1,614,103(0.04%)#359 |
| 7. | Skokie | 607 | 35,296(1.72%)#7 | 1,614,103(0.04%)#405 |
| 8. | Palatine | 591 | 35,296(1.67%)#8 | 1,614,103(0.04%)#414 |
| 9. | Buffalo Grove | 426 | 35,296(1.21%)#9 | 1,614,103(0.03%)#553 |
| 10. | Streamwood | 399 | 35,296(1.13%)#10 | 1,614,103(0.02%)#586 |
| 11. | Naperville | 395 | 35,296(1.12%)#11 | 1,614,103(0.02%)#592 |
| 12. | Joliet | 354 | 35,296(1.00%)#12 | 1,614,103(0.02%)#655 |
| 13. | Park Ridge | 350 | 35,296(0.99%)#13 | 1,614,103(0.02%)#665 |
| 14. | Aurora | 308 | 35,296(0.87%)#14 | 1,614,103(0.02%)#731 |
| 15. | Elk Grove Village | 283 | 35,296(0.80%)#15 | 1,614,103(0.02%)#776 |
| 16. | Bloomington | 278 | 35,296(0.79%)#16 | 1,614,103(0.02%)#784 |
| 17. | Mount Prospect | 268 | 35,296(0.76%)#17 | 1,614,103(0.02%)#811 |
| 18. | Rantoul | 268 | 35,296(0.76%)#18 | 1,614,103(0.02%)#812 |
| 19. | Rolling Meadows | 267 | 35,296(0.76%)#19 | 1,614,103(0.02%)#815 |
| 20. | Downers Grove | 260 | 35,296(0.74%)#20 | 1,614,103(0.02%)#840 |
| 21. | Glenview | 256 | 35,296(0.73%)#21 | 1,614,103(0.02%)#852 |
| 22. | Northbrook | 249 | 35,296(0.71%)#22 | 1,614,103(0.02%)#872 |
| 23. | Peoria | 239 | 35,296(0.68%)#23 | 1,614,103(0.01%)#901 |
| 24. | Urbana | 239 | 35,296(0.68%)#24 | 1,614,103(0.01%)#903 |
| 25. | O Fallon | 238 | 35,296(0.67%)#25 | 1,614,103(0.01%)#906 |
| 26. | Lake In The Hills | 232 | 35,296(0.66%)#26 | 1,614,103(0.01%)#923 |
| 27. | Champaign | 224 | 35,296(0.63%)#27 | 1,614,103(0.01%)#946 |
| 28. | Algonquin | 216 | 35,296(0.61%)#28 | 1,614,103(0.01%)#971 |
| 29. | Morton Grove | 205 | 35,296(0.58%)#29 | 1,614,103(0.01%)#1,004 |
| 30. | Carbondale | 200 | 35,296(0.57%)#30 | 1,614,103(0.01%)#1,016 |
| 31. | Waukegan | 194 | 35,296(0.55%)#31 | 1,614,103(0.01%)#1,043 |
| 32. | Grayslake | 194 | 35,296(0.55%)#32 | 1,614,103(0.01%)#1,046 |
| 33. | Peru | 185 | 35,296(0.52%)#33 | 1,614,103(0.01%)#1,099 |
| 34. | Geneva | 183 | 35,296(0.52%)#34 | 1,614,103(0.01%)#1,109 |
| 35. | Bolingbrook | 182 | 35,296(0.52%)#35 | 1,614,103(0.01%)#1,111 |
| 36. | Itasca | 182 | 35,296(0.52%)#36 | 1,614,103(0.01%)#1,117 |
| 37. | Lake Zurich | 173 | 35,296(0.49%)#37 | 1,614,103(0.01%)#1,154 |
| 38. | Huntley | 171 | 35,296(0.48%)#38 | 1,614,103(0.01%)#1,167 |
| 39. | Gilberts | 170 | 35,296(0.48%)#39 | 1,614,103(0.01%)#1,172 |
| 40. | Elgin | 153 | 35,296(0.43%)#40 | 1,614,103(0.01%)#1,277 |
| 41. | Highland Park | 153 | 35,296(0.43%)#41 | 1,614,103(0.01%)#1,280 |
| 42. | South Elgin | 152 | 35,296(0.43%)#42 | 1,614,103(0.01%)#1,287 |
| 43. | Mokena | 151 | 35,296(0.43%)#43 | 1,614,103(0.01%)#1,297 |
| 44. | Glendale Heights | 150 | 35,296(0.42%)#44 | 1,614,103(0.01%)#1,303 |
| 45. | Dekalb | 149 | 35,296(0.42%)#45 | 1,614,103(0.01%)#1,314 |
| 46. | Belleville | 148 | 35,296(0.42%)#46 | 1,614,103(0.01%)#1,322 |
| 47. | Pekin | 147 | 35,296(0.42%)#47 | 1,614,103(0.01%)#1,329 |
| 48. | Wilmette | 147 | 35,296(0.42%)#48 | 1,614,103(0.01%)#1,330 |
| 49. | Bartlett | 142 | 35,296(0.40%)#49 | 1,614,103(0.01%)#1,362 |
| 50. | Lombard | 136 | 35,296(0.39%)#50 | 1,614,103(0.01%)#1,413 |
| 51. | North Chicago | 134 | 35,296(0.38%)#51 | 1,614,103(0.01%)#1,430 |
| 52. | Wheaton | 133 | 35,296(0.38%)#52 | 1,614,103(0.01%)#1,436 |
| 53. | Elmhurst | 133 | 35,296(0.38%)#53 | 1,614,103(0.01%)#1,437 |
| 54. | Woodridge | 131 | 35,296(0.37%)#54 | 1,614,103(0.01%)#1,454 |
| 55. | Springfield | 123 | 35,296(0.35%)#55 | 1,614,103(0.01%)#1,522 |
| 56. | Carol Stream | 121 | 35,296(0.34%)#56 | 1,614,103(0.01%)#1,536 |
| 57. | River Forest | 121 | 35,296(0.34%)#57 | 1,614,103(0.01%)#1,539 |
| 58. | Vernon Hills | 119 | 35,296(0.34%)#58 | 1,614,103(0.01%)#1,564 |
| 59. | Warrenville | 119 | 35,296(0.34%)#59 | 1,614,103(0.01%)#1,567 |
| 60. | Bloomingdale | 117 | 35,296(0.33%)#60 | 1,614,103(0.01%)#1,583 |
| 61. | Lincolnwood | 117 | 35,296(0.33%)#61 | 1,614,103(0.01%)#1,585 |
| 62. | Rockford | 114 | 35,296(0.32%)#62 | 1,614,103(0.01%)#1,612 |
| 63. | Des Plaines | 111 | 35,296(0.31%)#63 | 1,614,103(0.01%)#1,643 |
| 64. | Maryville | 110 | 35,296(0.31%)#64 | 1,614,103(0.01%)#1,663 |
| 65. | Berwyn | 101 | 35,296(0.29%)#65 | 1,614,103(0.01%)#1,741 |
| 66. | Boulder Hill | 101 | 35,296(0.29%)#66 | 1,614,103(0.01%)#1,745 |
| 67. | Lindenhurst | 94 | 35,296(0.27%)#67 | 1,614,103(0.01%)#1,818 |
| 68. | Woodstock | 93 | 35,296(0.26%)#68 | 1,614,103(0.01%)#1,827 |
| 69. | Niles | 92 | 35,296(0.26%)#69 | 1,614,103(0.01%)#1,842 |
| 70. | Lockport | 92 | 35,296(0.26%)#70 | 1,614,103(0.01%)#1,843 |
| 71. | Libertyville | 88 | 35,296(0.25%)#71 | 1,614,103(0.01%)#1,906 |
| 72. | Crestwood | 88 | 35,296(0.25%)#72 | 1,614,103(0.01%)#1,910 |
| 73. | Crystal Lake | 86 | 35,296(0.24%)#73 | 1,614,103(0.01%)#1,935 |
| 74. | Long Grove | 86 | 35,296(0.24%)#74 | 1,614,103(0.01%)#1,948 |
| 75. | Swansea | 84 | 35,296(0.24%)#75 | 1,614,103(0.01%)#1,970 |
| 76. | The Galena Territory | 84 | 35,296(0.24%)#76 | 1,614,103(0.01%)#1,978 |
| 77. | Wheeling | 83 | 35,296(0.24%)#77 | 1,614,103(0.01%)#1,980 |
| 78. | Jerseyville | 83 | 35,296(0.24%)#78 | 1,614,103(0.01%)#1,986 |
| 79. | Bethalto | 81 | 35,296(0.23%)#79 | 1,614,103(0.01%)#2,013 |
| 80. | Western Springs | 79 | 35,296(0.22%)#80 | 1,614,103(0.00%)#2,055 |
| 81. | St Charles | 78 | 35,296(0.22%)#81 | 1,614,103(0.00%)#2,069 |
| 82. | Hinckley | 77 | 35,296(0.22%)#82 | 1,614,103(0.00%)#2,102 |
| 83. | Minooka | 75 | 35,296(0.21%)#83 | 1,614,103(0.00%)#2,129 |
| 84. | Normal | 73 | 35,296(0.21%)#84 | 1,614,103(0.00%)#2,161 |
| 85. | Monmouth | 73 | 35,296(0.21%)#85 | 1,614,103(0.00%)#2,173 |
| 86. | Plainfield | 69 | 35,296(0.20%)#86 | 1,614,103(0.00%)#2,225 |
| 87. | Mahomet | 67 | 35,296(0.19%)#87 | 1,614,103(0.00%)#2,267 |
| 88. | Darien | 66 | 35,296(0.19%)#88 | 1,614,103(0.00%)#2,283 |
| 89. | Lincolnshire | 65 | 35,296(0.18%)#89 | 1,614,103(0.00%)#2,316 |
| 90. | Roselle | 64 | 35,296(0.18%)#90 | 1,614,103(0.00%)#2,326 |
| 91. | Elmwood Park | 62 | 35,296(0.18%)#91 | 1,614,103(0.00%)#2,375 |
| 92. | Antioch | 61 | 35,296(0.17%)#92 | 1,614,103(0.00%)#2,396 |
| 93. | Wauconda | 61 | 35,296(0.17%)#93 | 1,614,103(0.00%)#2,397 |
| 94. | Rochester | 60 | 35,296(0.17%)#94 | 1,614,103(0.00%)#2,429 |
| 95. | Mchenry | 59 | 35,296(0.17%)#95 | 1,614,103(0.00%)#2,434 |
| 96. | Scott Afb | 59 | 35,296(0.17%)#96 | 1,614,103(0.00%)#2,458 |
| 97. | Gardner | 59 | 35,296(0.17%)#97 | 1,614,103(0.00%)#2,461 |
| 98. | Quincy | 57 | 35,296(0.16%)#98 | 1,614,103(0.00%)#2,482 |
| 99. | Riverside | 56 | 35,296(0.16%)#99 | 1,614,103(0.00%)#2,518 |
| 100. | Oak Lawn | 55 | 35,296(0.16%)#100 | 1,614,103(0.00%)#2,538 |
Common Questions
What are the Top 10 Cities with the Largest Bhutanese Community in Illinois?
Top 10 Cities with the Largest Bhutanese Community in Illinois are:
#1
9,659
#2
2,012
#3
1,140
#4
891
#5
707
#6
697
#7
607
#8
591
#9
426
#10
399
What city has the Largest Bhutanese Community in Illinois?
Chicago has the Largest Bhutanese Community in Illinois with 9,659.
What is the Total Bhutanese Population in the State of Illinois?
Total Bhutanese Population in Illinois is 35,296.
What is the Total Bhutanese Population in the United States?
Total Bhutanese Population in the United States is 1,614,103.