Cities with the Largest Bhutanese Community in the United States
RELATED REPORTS & OPTIONS
Bhutanese
United States
Compare Cities
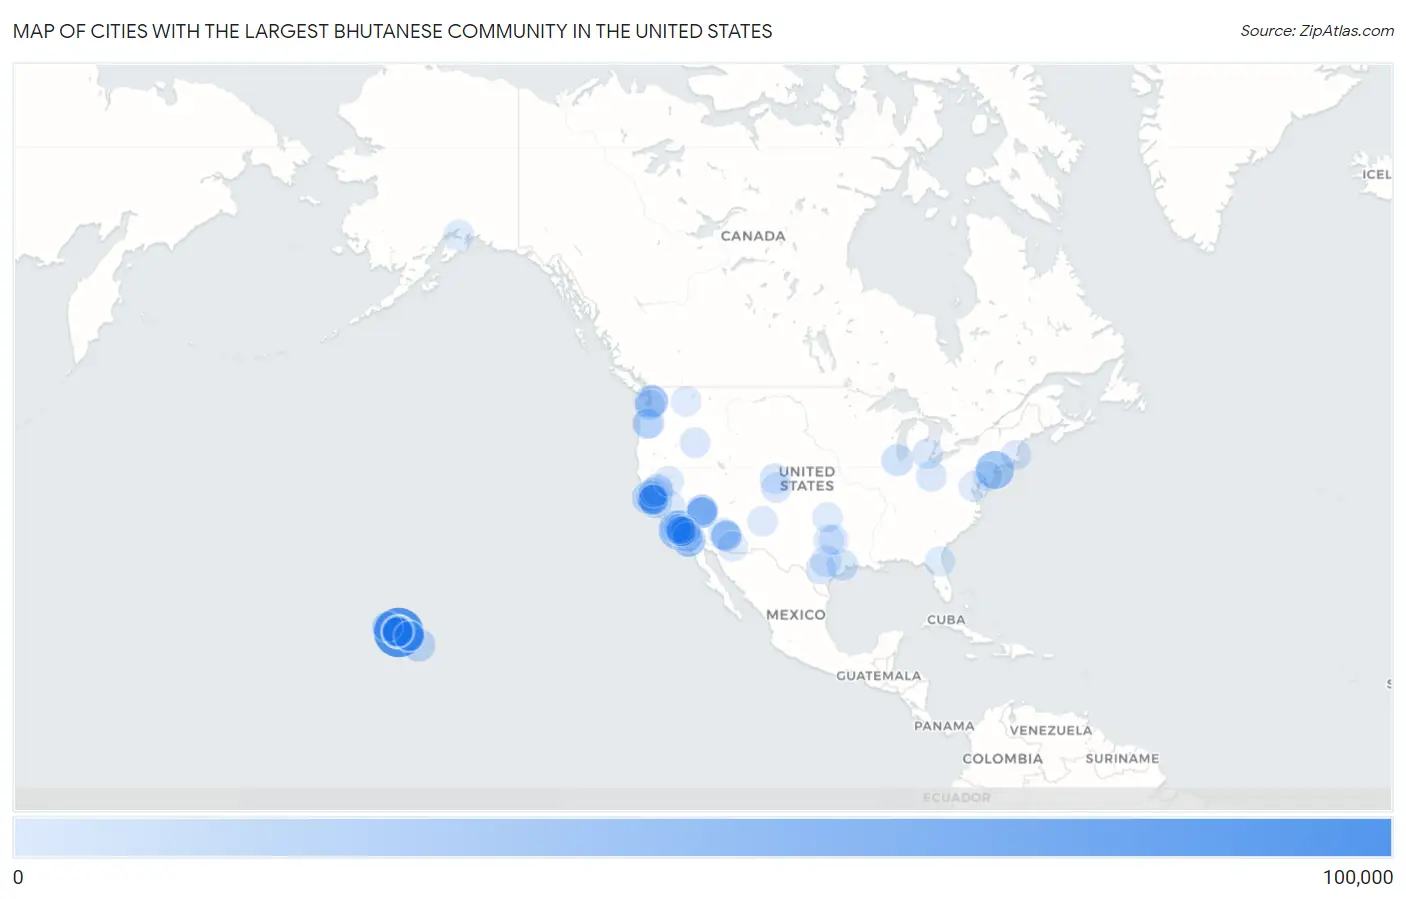
Map of Cities with the Largest Bhutanese Community in the United States
0
100,000
Cities with the Largest Bhutanese Community in the United States
| City | Bhutanese | vs State | vs National | |
| 1. | Urban Honolulu | 93,714 | 321,528(29.15%)#1 | 1,614,103(5.81%)#1 |
| 2. | Los Angeles | 45,377 | 480,217(9.45%)#1 | 1,614,103(2.81%)#2 |
| 3. | New York | 37,567 | 61,270(61.31%)#1 | 1,614,103(2.33%)#3 |
| 4. | Torrance | 19,987 | 480,217(4.16%)#2 | 1,614,103(1.24%)#4 |
| 5. | San Diego | 19,700 | 480,217(4.10%)#3 | 1,614,103(1.22%)#5 |
| 6. | East Honolulu | 19,293 | 321,528(6.00%)#2 | 1,614,103(1.20%)#6 |
| 7. | Pearl City | 17,937 | 321,528(5.58%)#3 | 1,614,103(1.11%)#7 |
| 8. | San Jose | 17,359 | 480,217(3.61%)#4 | 1,614,103(1.08%)#8 |
| 9. | San Francisco | 16,945 | 480,217(3.53%)#5 | 1,614,103(1.05%)#9 |
| 10. | Seattle | 16,563 | 93,123(17.79%)#1 | 1,614,103(1.03%)#10 |
| 11. | Hilo | 15,178 | 321,528(4.72%)#4 | 1,614,103(0.94%)#11 |
| 12. | Kaneohe | 13,708 | 321,528(4.26%)#5 | 1,614,103(0.85%)#12 |
| 13. | Irvine | 10,979 | 480,217(2.29%)#6 | 1,614,103(0.68%)#13 |
| 14. | Mililani Town | 10,877 | 321,528(3.38%)#6 | 1,614,103(0.67%)#14 |
| 15. | Sacramento | 9,890 | 480,217(2.06%)#7 | 1,614,103(0.61%)#15 |
| 16. | Chicago | 9,659 | 35,296(27.37%)#1 | 1,614,103(0.60%)#16 |
| 17. | Mililani Mauka | 9,659 | 321,528(3.00%)#7 | 1,614,103(0.60%)#17 |
| 18. | Kailua Cdp Honolulu County | 8,133 | 321,528(2.53%)#8 | 1,614,103(0.50%)#18 |
| 19. | Portland | 7,855 | 36,120(21.75%)#1 | 1,614,103(0.49%)#19 |
| 20. | Las Vegas | 6,311 | 30,709(20.55%)#1 | 1,614,103(0.39%)#20 |
| 21. | Houston | 6,096 | 68,134(8.95%)#1 | 1,614,103(0.38%)#21 |
| 22. | Gardena | 5,563 | 480,217(1.16%)#8 | 1,614,103(0.34%)#22 |
| 23. | Austin | 5,502 | 68,134(8.08%)#2 | 1,614,103(0.34%)#23 |
| 24. | Bellevue | 5,501 | 93,123(5.91%)#2 | 1,614,103(0.34%)#24 |
| 25. | Ewa Gentry | 5,338 | 321,528(1.66%)#9 | 1,614,103(0.33%)#25 |
| 26. | Kahului | 5,275 | 321,528(1.64%)#10 | 1,614,103(0.33%)#26 |
| 27. | Oakland | 5,089 | 480,217(1.06%)#9 | 1,614,103(0.32%)#27 |
| 28. | Waipahu | 5,017 | 321,528(1.56%)#11 | 1,614,103(0.31%)#28 |
| 29. | Halawa | 4,935 | 321,528(1.53%)#12 | 1,614,103(0.31%)#29 |
| 30. | Waimalu | 4,887 | 321,528(1.52%)#13 | 1,614,103(0.30%)#30 |
| 31. | Henderson | 4,880 | 30,709(15.89%)#2 | 1,614,103(0.30%)#31 |
| 32. | Kapolei | 4,764 | 321,528(1.48%)#14 | 1,614,103(0.30%)#32 |
| 33. | Phoenix | 4,713 | 29,238(16.12%)#1 | 1,614,103(0.29%)#33 |
| 34. | Wailuku | 4,540 | 321,528(1.41%)#15 | 1,614,103(0.28%)#34 |
| 35. | San Antonio | 4,530 | 68,134(6.65%)#3 | 1,614,103(0.28%)#35 |
| 36. | Rancho Palos Verdes | 4,524 | 480,217(0.94%)#10 | 1,614,103(0.28%)#36 |
| 37. | Huntington Beach | 4,446 | 480,217(0.93%)#11 | 1,614,103(0.28%)#37 |
| 38. | Long Beach | 4,392 | 480,217(0.91%)#12 | 1,614,103(0.27%)#38 |
| 39. | Enterprise | 4,239 | 30,709(13.80%)#3 | 1,614,103(0.26%)#39 |
| 40. | Wahiawa | 4,237 | 321,528(1.32%)#16 | 1,614,103(0.26%)#40 |
| 41. | Denver | 3,897 | 28,213(13.81%)#1 | 1,614,103(0.24%)#41 |
| 42. | Monterey Park | 3,893 | 480,217(0.81%)#13 | 1,614,103(0.24%)#42 |
| 43. | Tacoma | 3,844 | 93,123(4.13%)#3 | 1,614,103(0.24%)#43 |
| 44. | Sunnyvale | 3,811 | 480,217(0.79%)#14 | 1,614,103(0.24%)#44 |
| 45. | Waipio | 3,783 | 321,528(1.18%)#17 | 1,614,103(0.23%)#45 |
| 46. | Fresno | 3,771 | 480,217(0.79%)#15 | 1,614,103(0.23%)#46 |
| 47. | Chula Vista | 3,760 | 480,217(0.78%)#16 | 1,614,103(0.23%)#47 |
| 48. | Aiea | 3,582 | 321,528(1.11%)#18 | 1,614,103(0.22%)#48 |
| 49. | Makakilo | 3,574 | 321,528(1.11%)#19 | 1,614,103(0.22%)#49 |
| 50. | Columbus | 3,542 | 23,617(15.00%)#1 | 1,614,103(0.22%)#50 |
| 51. | Spring Valley | 3,462 | 30,709(11.27%)#4 | 1,614,103(0.21%)#51 |
| 52. | Redondo Beach | 3,407 | 480,217(0.71%)#17 | 1,614,103(0.21%)#52 |
| 53. | Anaheim | 3,314 | 480,217(0.69%)#18 | 1,614,103(0.21%)#53 |
| 54. | Novi | 3,275 | 24,186(13.54%)#1 | 1,614,103(0.20%)#54 |
| 55. | Ahuimanu | 3,166 | 321,528(0.98%)#20 | 1,614,103(0.20%)#55 |
| 56. | Colorado Springs | 3,143 | 28,213(11.14%)#2 | 1,614,103(0.19%)#56 |
| 57. | Berkeley | 3,092 | 480,217(0.64%)#19 | 1,614,103(0.19%)#57 |
| 58. | Elk Grove | 2,987 | 480,217(0.62%)#20 | 1,614,103(0.19%)#58 |
| 59. | San Mateo | 2,886 | 480,217(0.60%)#21 | 1,614,103(0.18%)#59 |
| 60. | Fremont | 2,850 | 480,217(0.59%)#22 | 1,614,103(0.18%)#60 |
| 61. | Boise City | 2,844 | 9,926(28.65%)#1 | 1,614,103(0.18%)#61 |
| 62. | Anchorage | 2,799 | 5,438(51.47%)#1 | 1,614,103(0.17%)#62 |
| 63. | Santa Clara | 2,781 | 480,217(0.58%)#23 | 1,614,103(0.17%)#63 |
| 64. | Fort Worth | 2,764 | 68,134(4.06%)#4 | 1,614,103(0.17%)#64 |
| 65. | Washington | 2,719 | 2,719(100.00%)#1 | 1,614,103(0.17%)#65 |
| 66. | Pasadena | 2,716 | 480,217(0.57%)#24 | 1,614,103(0.17%)#66 |
| 67. | Dallas | 2,686 | 68,134(3.94%)#5 | 1,614,103(0.17%)#67 |
| 68. | Chandler | 2,599 | 29,238(8.89%)#2 | 1,614,103(0.16%)#68 |
| 69. | Philadelphia | 2,596 | 18,192(14.27%)#1 | 1,614,103(0.16%)#69 |
| 70. | Waikele | 2,592 | 321,528(0.81%)#21 | 1,614,103(0.16%)#70 |
| 71. | Gilbert | 2,565 | 29,238(8.77%)#3 | 1,614,103(0.16%)#71 |
| 72. | Lihue | 2,560 | 321,528(0.80%)#22 | 1,614,103(0.16%)#72 |
| 73. | Mesa | 2,555 | 29,238(8.74%)#4 | 1,614,103(0.16%)#73 |
| 74. | Mountain View | 2,550 | 480,217(0.53%)#25 | 1,614,103(0.16%)#74 |
| 75. | Ocean Pointe | 2,518 | 321,528(0.78%)#23 | 1,614,103(0.16%)#75 |
| 76. | Ewa Beach | 2,496 | 321,528(0.78%)#24 | 1,614,103(0.15%)#76 |
| 77. | Kapaa | 2,476 | 321,528(0.77%)#25 | 1,614,103(0.15%)#77 |
| 78. | Reno | 2,463 | 30,709(8.02%)#5 | 1,614,103(0.15%)#78 |
| 79. | North Las Vegas | 2,447 | 30,709(7.97%)#6 | 1,614,103(0.15%)#79 |
| 80. | Jacksonville | 2,446 | 40,015(6.11%)#1 | 1,614,103(0.15%)#80 |
| 81. | Tucson | 2,419 | 29,238(8.27%)#5 | 1,614,103(0.15%)#81 |
| 82. | Albuquerque | 2,395 | 5,821(41.14%)#1 | 1,614,103(0.15%)#82 |
| 83. | Beaverton | 2,394 | 36,120(6.63%)#2 | 1,614,103(0.15%)#83 |
| 84. | Royal Kunia | 2,385 | 321,528(0.74%)#26 | 1,614,103(0.15%)#84 |
| 85. | Oklahoma City | 2,357 | 8,188(28.79%)#1 | 1,614,103(0.15%)#85 |
| 86. | Santa Clarita | 2,357 | 480,217(0.49%)#26 | 1,614,103(0.15%)#86 |
| 87. | Boston | 2,313 | 20,971(11.03%)#1 | 1,614,103(0.14%)#87 |
| 88. | Kihei | 2,268 | 321,528(0.71%)#27 | 1,614,103(0.14%)#88 |
| 89. | Culver City | 2,249 | 480,217(0.47%)#27 | 1,614,103(0.14%)#89 |
| 90. | Oceanside | 2,178 | 480,217(0.45%)#28 | 1,614,103(0.13%)#90 |
| 91. | Pukalani | 2,178 | 321,528(0.68%)#28 | 1,614,103(0.13%)#91 |
| 92. | Fairfield | 2,169 | 480,217(0.45%)#29 | 1,614,103(0.13%)#92 |
| 93. | Riverside | 2,166 | 480,217(0.45%)#30 | 1,614,103(0.13%)#93 |
| 94. | Lake Forest | 2,122 | 480,217(0.44%)#31 | 1,614,103(0.13%)#94 |
| 95. | Thousand Oaks | 2,120 | 480,217(0.44%)#32 | 1,614,103(0.13%)#95 |
| 96. | Carlsbad | 2,119 | 480,217(0.44%)#33 | 1,614,103(0.13%)#96 |
| 97. | Cypress | 2,109 | 480,217(0.44%)#34 | 1,614,103(0.13%)#97 |
| 98. | Spokane | 2,105 | 93,123(2.26%)#4 | 1,614,103(0.13%)#98 |
| 99. | Glendale | 2,092 | 480,217(0.44%)#35 | 1,614,103(0.13%)#99 |
| 100. | Cerritos | 2,078 | 480,217(0.43%)#36 | 1,614,103(0.13%)#100 |
Common Questions
What are the Top 10 Cities with the Largest Bhutanese Community in the United States?
Top 10 Cities with the Largest Bhutanese Community in the United States are:
#1
93,714
#2
45,377
#3
37,567
#4
19,987
#5
19,700
#6
19,293
#7
17,937
#8
17,359
#9
16,945
#10
16,563
What city has the Largest Bhutanese Community in the United States?
Urban Honolulu has the Largest Bhutanese Community in the United States with 93,714.
What is the Total Bhutanese Population in the United States?
Total Bhutanese Population in the United States is 1,614,103.