Zip Codes with the Highest Percentage of Tlingit-Haida Population in Washington
RELATED REPORTS & OPTIONS
Tlingit-Haida
Washington
Compare Zip Codes
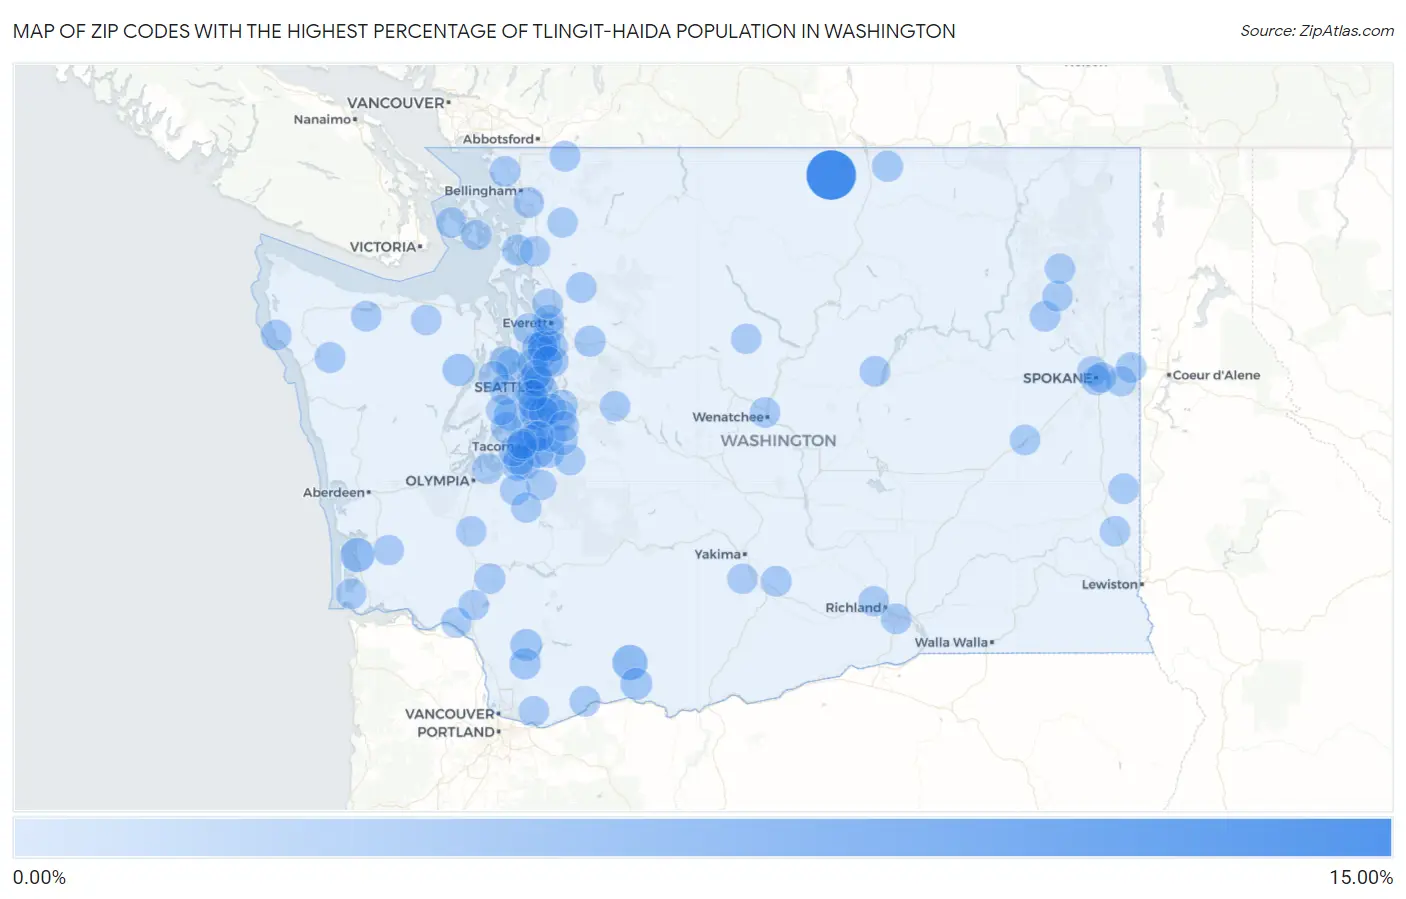
Map of Zip Codes with the Highest Percentage of Tlingit-Haida Population in Washington
0.00%
15.00%
Zip Codes with the Highest Percentage of Tlingit-Haida Population in Washington
| Zip Code | Tlingit-Haida | vs State | vs National | |
| 1. | 98827 | 12.53% | 0.082%(+12.4)#1 | 0.0082%(+12.5)#11 |
| 2. | 98650 | 3.12% | 0.082%(+3.04)#2 | 0.0082%(+3.12)#29 |
| 3. | 98527 | 2.46% | 0.082%(+2.38)#3 | 0.0082%(+2.45)#32 |
| 4. | 98320 | 1.35% | 0.082%(+1.27)#4 | 0.0082%(+1.34)#42 |
| 5. | 98011 | 1.05% | 0.082%(+0.966)#5 | 0.0082%(+1.04)#51 |
| 6. | 98672 | 1.03% | 0.082%(+0.947)#6 | 0.0082%(+1.02)#52 |
| 7. | 98603 | 1.01% | 0.082%(+0.924)#7 | 0.0082%(+0.998)#54 |
| 8. | 98148 | 0.85% | 0.082%(+0.772)#8 | 0.0082%(+0.846)#66 |
| 9. | 98359 | 0.82% | 0.082%(+0.736)#9 | 0.0082%(+0.810)#67 |
| 10. | 98439 | 0.76% | 0.082%(+0.675)#10 | 0.0082%(+0.749)#71 |
| 11. | 98444 | 0.75% | 0.082%(+0.670)#11 | 0.0082%(+0.744)#72 |
| 12. | 98601 | 0.75% | 0.082%(+0.663)#12 | 0.0082%(+0.737)#73 |
| 13. | 98144 | 0.68% | 0.082%(+0.594)#13 | 0.0082%(+0.668)#79 |
| 14. | 98166 | 0.62% | 0.082%(+0.538)#14 | 0.0082%(+0.612)#85 |
| 15. | 98257 | 0.58% | 0.082%(+0.498)#15 | 0.0082%(+0.572)#89 |
| 16. | 98844 | 0.53% | 0.082%(+0.447)#16 | 0.0082%(+0.521)#93 |
| 17. | 98272 | 0.52% | 0.082%(+0.439)#17 | 0.0082%(+0.513)#94 |
| 18. | 98392 | 0.50% | 0.082%(+0.417)#18 | 0.0082%(+0.491)#99 |
| 19. | 98332 | 0.49% | 0.082%(+0.405)#19 | 0.0082%(+0.479)#102 |
| 20. | 98236 | 0.49% | 0.082%(+0.404)#20 | 0.0082%(+0.478)#103 |
| 21. | 98087 | 0.47% | 0.082%(+0.389)#21 | 0.0082%(+0.463)#109 |
| 22. | 98331 | 0.42% | 0.082%(+0.341)#22 | 0.0082%(+0.415)#113 |
| 23. | 98026 | 0.41% | 0.082%(+0.328)#23 | 0.0082%(+0.402)#117 |
| 24. | 98266 | 0.38% | 0.082%(+0.294)#24 | 0.0082%(+0.368)#123 |
| 25. | 98648 | 0.37% | 0.082%(+0.290)#25 | 0.0082%(+0.364)#124 |
| 26. | 99173 | 0.37% | 0.082%(+0.287)#26 | 0.0082%(+0.361)#128 |
| 27. | 98953 | 0.35% | 0.082%(+0.273)#27 | 0.0082%(+0.347)#131 |
| 28. | 98363 | 0.33% | 0.082%(+0.247)#28 | 0.0082%(+0.321)#139 |
| 29. | 98023 | 0.33% | 0.082%(+0.245)#29 | 0.0082%(+0.319)#140 |
| 30. | 98036 | 0.32% | 0.082%(+0.240)#30 | 0.0082%(+0.314)#141 |
| 31. | 99181 | 0.31% | 0.082%(+0.229)#31 | 0.0082%(+0.303)#145 |
| 32. | 98422 | 0.30% | 0.082%(+0.217)#32 | 0.0082%(+0.291)#150 |
| 33. | 98350 | 0.28% | 0.082%(+0.202)#33 | 0.0082%(+0.276)#160 |
| 34. | 98223 | 0.28% | 0.082%(+0.197)#34 | 0.0082%(+0.272)#161 |
| 35. | 98229 | 0.28% | 0.082%(+0.193)#35 | 0.0082%(+0.267)#163 |
| 36. | 98591 | 0.27% | 0.082%(+0.190)#36 | 0.0082%(+0.264)#164 |
| 37. | 98248 | 0.27% | 0.082%(+0.190)#37 | 0.0082%(+0.264)#165 |
| 38. | 98390 | 0.26% | 0.082%(+0.179)#38 | 0.0082%(+0.253)#167 |
| 39. | 99115 | 0.25% | 0.082%(+0.163)#39 | 0.0082%(+0.237)#172 |
| 40. | 99130 | 0.24% | 0.082%(+0.158)#40 | 0.0082%(+0.232)#173 |
| 41. | 99336 | 0.24% | 0.082%(+0.157)#41 | 0.0082%(+0.231)#174 |
| 42. | 98624 | 0.23% | 0.082%(+0.152)#42 | 0.0082%(+0.226)#178 |
| 43. | 98516 | 0.23% | 0.082%(+0.149)#43 | 0.0082%(+0.223)#179 |
| 44. | 98045 | 0.22% | 0.082%(+0.138)#44 | 0.0082%(+0.212)#180 |
| 45. | 99027 | 0.22% | 0.082%(+0.135)#45 | 0.0082%(+0.209)#181 |
| 46. | 98002 | 0.22% | 0.082%(+0.135)#46 | 0.0082%(+0.209)#182 |
| 47. | 98531 | 0.22% | 0.082%(+0.133)#47 | 0.0082%(+0.207)#185 |
| 48. | 98203 | 0.21% | 0.082%(+0.129)#48 | 0.0082%(+0.203)#187 |
| 49. | 98012 | 0.21% | 0.082%(+0.127)#49 | 0.0082%(+0.201)#189 |
| 50. | 99032 | 0.20% | 0.082%(+0.121)#50 | 0.0082%(+0.195)#190 |
| 51. | 98250 | 0.20% | 0.082%(+0.119)#51 | 0.0082%(+0.193)#191 |
| 52. | 98371 | 0.20% | 0.082%(+0.118)#52 | 0.0082%(+0.192)#192 |
| 53. | 98370 | 0.20% | 0.082%(+0.116)#53 | 0.0082%(+0.190)#196 |
| 54. | 98499 | 0.19% | 0.082%(+0.111)#54 | 0.0082%(+0.185)#199 |
| 55. | 98310 | 0.18% | 0.082%(+0.098)#55 | 0.0082%(+0.172)#207 |
| 56. | 98116 | 0.18% | 0.082%(+0.094)#56 | 0.0082%(+0.168)#212 |
| 57. | 98801 | 0.17% | 0.082%(+0.092)#57 | 0.0082%(+0.166)#215 |
| 58. | 98632 | 0.17% | 0.082%(+0.089)#58 | 0.0082%(+0.163)#219 |
| 59. | 98466 | 0.17% | 0.082%(+0.089)#59 | 0.0082%(+0.163)#220 |
| 60. | 98059 | 0.17% | 0.082%(+0.088)#60 | 0.0082%(+0.162)#221 |
| 61. | 98119 | 0.17% | 0.082%(+0.084)#61 | 0.0082%(+0.158)#228 |
| 62. | 98177 | 0.16% | 0.082%(+0.079)#62 | 0.0082%(+0.153)#232 |
| 63. | 98951 | 0.16% | 0.082%(+0.078)#63 | 0.0082%(+0.152)#235 |
| 64. | 98321 | 0.16% | 0.082%(+0.077)#64 | 0.0082%(+0.151)#236 |
| 65. | 99353 | 0.16% | 0.082%(+0.077)#65 | 0.0082%(+0.151)#238 |
| 66. | 98058 | 0.15% | 0.082%(+0.068)#66 | 0.0082%(+0.142)#245 |
| 67. | 98102 | 0.14% | 0.082%(+0.061)#67 | 0.0082%(+0.135)#250 |
| 68. | 99109 | 0.14% | 0.082%(+0.061)#68 | 0.0082%(+0.135)#252 |
| 69. | 98146 | 0.14% | 0.082%(+0.060)#69 | 0.0082%(+0.134)#254 |
| 70. | 98367 | 0.14% | 0.082%(+0.059)#70 | 0.0082%(+0.133)#255 |
| 71. | 98405 | 0.14% | 0.082%(+0.054)#71 | 0.0082%(+0.128)#258 |
| 72. | 98037 | 0.13% | 0.082%(+0.052)#72 | 0.0082%(+0.126)#259 |
| 73. | 98362 | 0.13% | 0.082%(+0.052)#73 | 0.0082%(+0.126)#260 |
| 74. | 99205 | 0.13% | 0.082%(+0.051)#74 | 0.0082%(+0.125)#261 |
| 75. | 98057 | 0.13% | 0.082%(+0.051)#75 | 0.0082%(+0.125)#262 |
| 76. | 98103 | 0.13% | 0.082%(+0.049)#76 | 0.0082%(+0.123)#265 |
| 77. | 98580 | 0.13% | 0.082%(+0.049)#77 | 0.0082%(+0.123)#266 |
| 78. | 98092 | 0.13% | 0.082%(+0.048)#78 | 0.0082%(+0.122)#267 |
| 79. | 98338 | 0.13% | 0.082%(+0.047)#79 | 0.0082%(+0.121)#268 |
| 80. | 98261 | 0.13% | 0.082%(+0.046)#80 | 0.0082%(+0.120)#270 |
| 81. | 98383 | 0.13% | 0.082%(+0.045)#81 | 0.0082%(+0.119)#271 |
| 82. | 98188 | 0.13% | 0.082%(+0.045)#82 | 0.0082%(+0.119)#272 |
| 83. | 98201 | 0.12% | 0.082%(+0.042)#83 | 0.0082%(+0.116)#275 |
| 84. | 98273 | 0.12% | 0.082%(+0.039)#84 | 0.0082%(+0.113)#279 |
| 85. | 98597 | 0.12% | 0.082%(+0.037)#85 | 0.0082%(+0.111)#283 |
| 86. | 99037 | 0.12% | 0.082%(+0.034)#86 | 0.0082%(+0.108)#287 |
| 87. | 99204 | 0.11% | 0.082%(+0.029)#87 | 0.0082%(+0.103)#295 |
| 88. | 98042 | 0.11% | 0.082%(+0.027)#88 | 0.0082%(+0.101)#298 |
| 89. | 98126 | 0.11% | 0.082%(+0.027)#89 | 0.0082%(+0.101)#299 |
| 90. | 98003 | 0.10% | 0.082%(+0.021)#90 | 0.0082%(+0.095)#312 |
| 91. | 98822 | 0.10% | 0.082%(+0.019)#91 | 0.0082%(+0.093)#313 |
| 92. | 99202 | 0.10% | 0.082%(+0.019)#92 | 0.0082%(+0.093)#314 |
| 93. | 98607 | 0.10% | 0.082%(+0.018)#93 | 0.0082%(+0.092)#316 |
| 94. | 98402 | 0.099% | 0.082%(+0.017)#94 | 0.0082%(+0.091)#321 |
| 95. | 98284 | 0.098% | 0.082%(+0.015)#95 | 0.0082%(+0.089)#324 |
| 96. | 98028 | 0.097% | 0.082%(+0.015)#96 | 0.0082%(+0.089)#325 |
| 97. | 98611 | 0.096% | 0.082%(+0.014)#97 | 0.0082%(+0.088)#326 |
| 98. | 98271 | 0.096% | 0.082%(+0.014)#98 | 0.0082%(+0.088)#327 |
| 99. | 98577 | 0.095% | 0.082%(+0.013)#99 | 0.0082%(+0.087)#329 |
| 100. | 99163 | 0.095% | 0.082%(+0.012)#100 | 0.0082%(+0.086)#330 |
Common Questions
What are the Top 10 Zip Codes with the Highest Percentage of Tlingit-Haida Population in Washington?
Top 10 Zip Codes with the Highest Percentage of Tlingit-Haida Population in Washington are:
What zip code has the Highest Percentage of Tlingit-Haida Population in Washington?
98827 has the Highest Percentage of Tlingit-Haida Population in Washington with 12.53%.
What is the Percentage of Tlingit-Haida Population in the State of Washington?
Percentage of Tlingit-Haida Population in Washington is 0.082%.
What is the Percentage of Tlingit-Haida Population in the United States?
Percentage of Tlingit-Haida Population in the United States is 0.0082%.