Cities with the Highest Percentage of Tlingit-Haida Population in the United States
RELATED REPORTS & OPTIONS
Tlingit-Haida
United States
Compare Cities
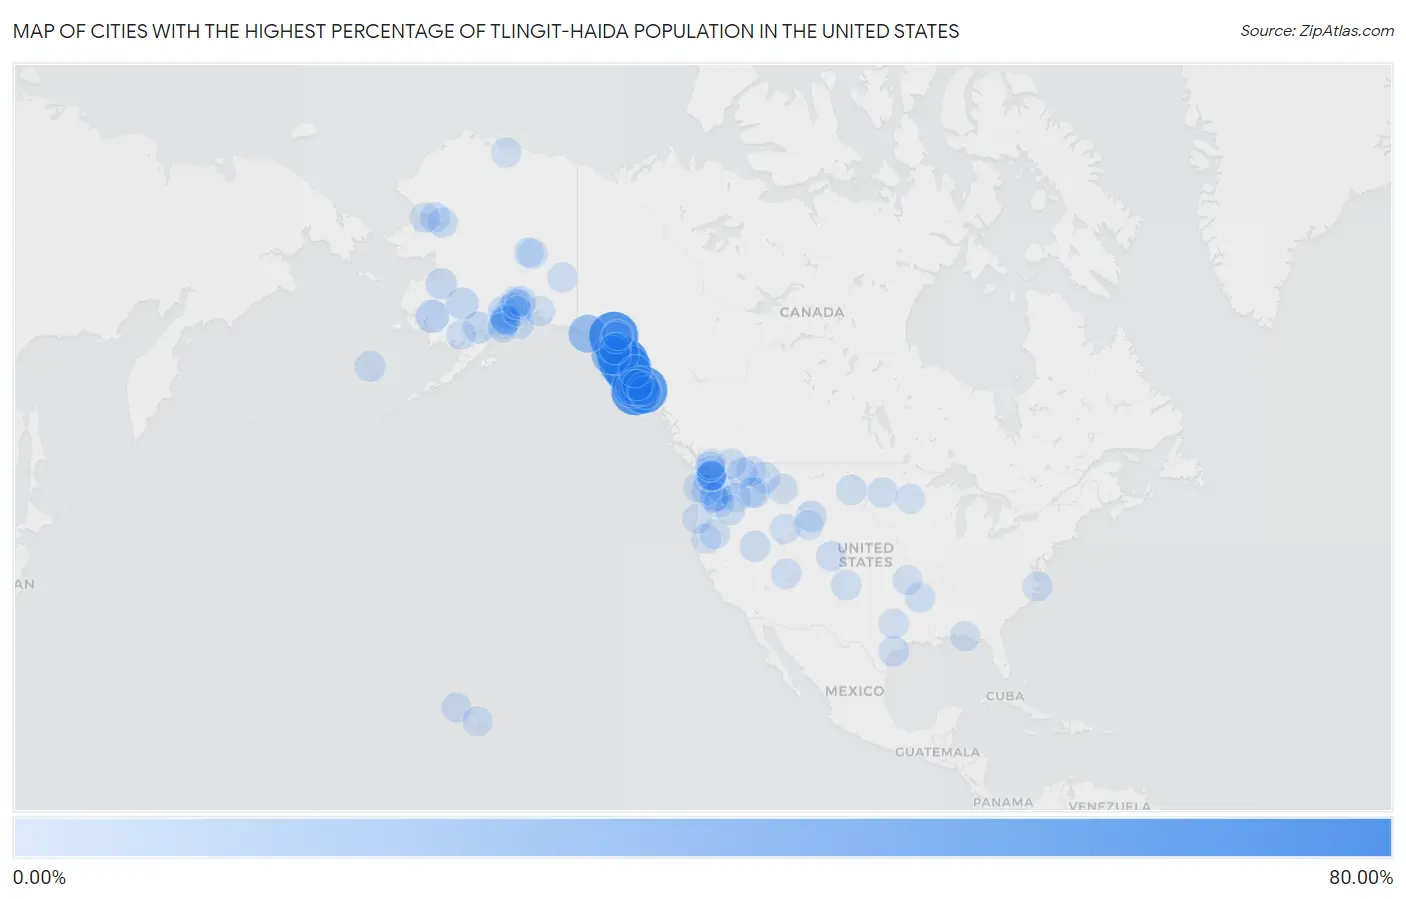
Map of Cities with the Highest Percentage of Tlingit-Haida Population in the United States
0.00%
80.00%
Cities with the Highest Percentage of Tlingit-Haida Population in the United States
| City | Tlingit-Haida | vs State | vs National | |
| 1. | Angoon | 76.85% | 1.70%(+75.1)#1 | 0.0082%(+76.8)#1 |
| 2. | Klukwan | 74.63% | 1.70%(+72.9)#2 | 0.0082%(+74.6)#2 |
| 3. | Hydaburg | 69.51% | 1.70%(+67.8)#3 | 0.0082%(+69.5)#3 |
| 4. | Kake | 69.34% | 1.70%(+67.6)#4 | 0.0082%(+69.3)#4 |
| 5. | Saxman | 67.59% | 1.70%(+65.9)#5 | 0.0082%(+67.6)#5 |
| 6. | Klawock | 51.24% | 1.70%(+49.5)#6 | 0.0082%(+51.2)#6 |
| 7. | Hoonah | 49.33% | 1.70%(+47.6)#7 | 0.0082%(+49.3)#7 |
| 8. | Kasaan | 36.59% | 1.70%(+34.9)#8 | 0.0082%(+36.6)#8 |
| 9. | Pelican | 35.09% | 1.70%(+33.4)#9 | 0.0082%(+35.1)#9 |
| 10. | Yakutat | 29.96% | 1.70%(+28.3)#10 | 0.0082%(+30.0)#10 |
| 11. | Craig | 22.55% | 1.70%(+20.9)#11 | 0.0082%(+22.5)#11 |
| 12. | Wrangell City And Borough | 21.23% | 1.70%(+19.5)#12 | 0.0082%(+21.2)#12 |
| 13. | Ketchikan | 12.67% | 1.70%(+11.0)#13 | 0.0082%(+12.7)#13 |
| 14. | Sitka City And Borough | 12.27% | 1.70%(+10.6)#14 | 0.0082%(+12.3)#14 |
| 15. | Kwethluk | 12.12% | 1.70%(+10.4)#15 | 0.0082%(+12.1)#15 |
| 16. | Juneau City And Borough | 11.00% | 1.70%(+9.30)#16 | 0.0082%(+11.0)#16 |
| 17. | Metlakatla | 10.23% | 1.70%(+8.53)#17 | 0.0082%(+10.2)#17 |
| 18. | Petersburg | 9.07% | 1.70%(+7.37)#18 | 0.0082%(+9.07)#18 |
| 19. | Sleetmute | 8.22% | 1.70%(+6.52)#19 | 0.0082%(+8.21)#19 |
| 20. | Roosevelt Estates | 7.90% | 0.0091%(+7.89)#1 | 0.0082%(+7.90)#20 |
| 21. | Nondalton | 7.50% | 1.70%(+5.80)#20 | 0.0082%(+7.49)#21 |
| 22. | Haines | 5.62% | 1.70%(+3.92)#21 | 0.0082%(+5.61)#22 |
| 23. | Grayling | 5.24% | 1.70%(+3.54)#22 | 0.0082%(+5.23)#23 |
| 24. | Trout Lake | 4.62% | 0.082%(+4.54)#1 | 0.0082%(+4.61)#24 |
| 25. | Kirby | 4.26% | 0.011%(+4.24)#1 | 0.0082%(+4.25)#25 |
| 26. | Tyonek | 4.07% | 1.70%(+2.37)#23 | 0.0082%(+4.07)#26 |
| 27. | Gustavus | 3.94% | 1.70%(+2.24)#24 | 0.0082%(+3.94)#27 |
| 28. | Esperance | 3.42% | 0.082%(+3.34)#2 | 0.0082%(+3.41)#28 |
| 29. | Bay Center | 3.33% | 0.082%(+3.25)#3 | 0.0082%(+3.33)#29 |
| 30. | Carlin | 3.25% | 0.0087%(+3.25)#1 | 0.0082%(+3.25)#30 |
| 31. | Canterwood | 2.98% | 0.082%(+2.89)#4 | 0.0082%(+2.97)#31 |
| 32. | White Salmon | 2.87% | 0.082%(+2.79)#5 | 0.0082%(+2.87)#32 |
| 33. | St Paul | 2.87% | 1.70%(+1.16)#25 | 0.0082%(+2.86)#33 |
| 34. | Camas | 2.70% | 0.028%(+2.67)#1 | 0.0082%(+2.69)#34 |
| 35. | Kooskia | 2.63% | 0.016%(+2.62)#1 | 0.0082%(+2.62)#35 |
| 36. | Bear Creek | 2.49% | 1.70%(+0.791)#26 | 0.0082%(+2.49)#36 |
| 37. | Eareckson Station | 2.41% | 1.70%(+0.707)#27 | 0.0082%(+2.40)#37 |
| 38. | Cohoe | 2.37% | 1.70%(+0.666)#28 | 0.0082%(+2.36)#38 |
| 39. | Point Comfort | 2.18% | 0.00079%(+2.18)#1 | 0.0082%(+2.18)#39 |
| 40. | Regent | 2.01% | 0.0066%(+2.01)#1 | 0.0082%(+2.01)#40 |
| 41. | Toledo | 1.91% | 0.082%(+1.83)#6 | 0.0082%(+1.90)#41 |
| 42. | Clayton | 1.88% | 0.0063%(+1.87)#1 | 0.0082%(+1.87)#42 |
| 43. | Thorne Bay | 1.87% | 1.70%(+0.164)#29 | 0.0082%(+1.86)#43 |
| 44. | North Pole | 1.85% | 1.70%(+0.144)#30 | 0.0082%(+1.84)#44 |
| 45. | Noorvik | 1.83% | 1.70%(+0.132)#31 | 0.0082%(+1.83)#45 |
| 46. | Oakes | 1.65% | 0.0066%(+1.64)#2 | 0.0082%(+1.64)#46 |
| 47. | Selawik | 1.62% | 1.70%(-0.087)#32 | 0.0082%(+1.61)#47 |
| 48. | Mill Bay | 1.60% | 1.70%(-0.099)#33 | 0.0082%(+1.60)#48 |
| 49. | Craigmont | 1.60% | 0.016%(+1.58)#2 | 0.0082%(+1.59)#49 |
| 50. | Helena West Side | 1.57% | 0.028%(+1.54)#2 | 0.0082%(+1.56)#50 |
| 51. | Bryant | 1.57% | 0.082%(+1.49)#7 | 0.0082%(+1.56)#51 |
| 52. | Dover | 1.53% | 0.016%(+1.51)#3 | 0.0082%(+1.52)#52 |
| 53. | Tok | 1.48% | 1.70%(-0.223)#34 | 0.0082%(+1.47)#53 |
| 54. | Indian Hills | 1.45% | 0.0062%(+1.45)#1 | 0.0082%(+1.45)#54 |
| 55. | Maupin | 1.40% | 0.034%(+1.37)#1 | 0.0082%(+1.40)#55 |
| 56. | Springdale | 1.36% | 0.082%(+1.28)#8 | 0.0082%(+1.36)#56 |
| 57. | Merrill | 1.33% | 0.034%(+1.29)#2 | 0.0082%(+1.32)#57 |
| 58. | Oroville | 1.31% | 0.082%(+1.23)#9 | 0.0082%(+1.30)#58 |
| 59. | Summitview | 1.31% | 0.082%(+1.23)#10 | 0.0082%(+1.30)#59 |
| 60. | Nikiski | 1.27% | 1.70%(-0.431)#35 | 0.0082%(+1.26)#60 |
| 61. | Escalante | 1.22% | 0.0085%(+1.21)#1 | 0.0082%(+1.21)#61 |
| 62. | Skagway | 1.19% | 1.70%(-0.515)#36 | 0.0082%(+1.18)#62 |
| 63. | Butte | 1.17% | 1.70%(-0.530)#37 | 0.0082%(+1.16)#63 |
| 64. | Wahiawa | 1.16% | 0.025%(+1.14)#1 | 0.0082%(+1.15)#64 |
| 65. | Etna | 1.12% | 0.0042%(+1.11)#1 | 0.0082%(+1.11)#65 |
| 66. | Nuiqsut | 1.06% | 1.70%(-0.639)#38 | 0.0082%(+1.06)#66 |
| 67. | Gopher Flats | 1.04% | 0.034%(+1.01)#3 | 0.0082%(+1.03)#67 |
| 68. | Willow | 1.02% | 1.70%(-0.678)#39 | 0.0082%(+1.02)#68 |
| 69. | Eglin Afb | 0.98% | 0.00087%(+0.978)#1 | 0.0082%(+0.970)#69 |
| 70. | Kalifornsky | 0.95% | 1.70%(-0.748)#40 | 0.0082%(+0.946)#70 |
| 71. | Kotzebue | 0.94% | 1.70%(-0.764)#41 | 0.0082%(+0.931)#71 |
| 72. | Point Mackenzie | 0.94% | 1.70%(-0.765)#42 | 0.0082%(+0.929)#72 |
| 73. | Elizabeth City | 0.92% | 0.0019%(+0.914)#1 | 0.0082%(+0.907)#73 |
| 74. | Kenai | 0.90% | 1.70%(-0.807)#43 | 0.0082%(+0.888)#74 |
| 75. | Wood Ridge Borough | 0.87% | 0.0016%(+0.870)#1 | 0.0082%(+0.864)#75 |
| 76. | Valdez | 0.86% | 1.70%(-0.839)#44 | 0.0082%(+0.856)#76 |
| 77. | Grace | 0.85% | 0.016%(+0.833)#4 | 0.0082%(+0.841)#77 |
| 78. | Perryville | 0.84% | 0.00089%(+0.844)#1 | 0.0082%(+0.837)#78 |
| 79. | Martha Lake | 0.82% | 0.082%(+0.735)#11 | 0.0082%(+0.809)#79 |
| 80. | Happy Valley | 0.80% | 1.70%(-0.901)#45 | 0.0082%(+0.794)#80 |
| 81. | Dayville | 0.78% | 0.034%(+0.745)#4 | 0.0082%(+0.770)#81 |
| 82. | Stevenson | 0.77% | 0.082%(+0.684)#12 | 0.0082%(+0.758)#82 |
| 83. | Monroe | 0.74% | 0.082%(+0.656)#13 | 0.0082%(+0.730)#83 |
| 84. | Orchidlands Estates | 0.71% | 0.025%(+0.683)#2 | 0.0082%(+0.700)#84 |
| 85. | Soldotna | 0.71% | 1.70%(-0.997)#46 | 0.0082%(+0.697)#85 |
| 86. | Sutton Alpine | 0.68% | 1.70%(-1.02)#47 | 0.0082%(+0.672)#86 |
| 87. | New Stuyahok | 0.66% | 1.70%(-1.04)#48 | 0.0082%(+0.655)#87 |
| 88. | Richland | 0.65% | 0.00079%(+0.651)#2 | 0.0082%(+0.643)#88 |
| 89. | College | 0.62% | 1.70%(-1.08)#49 | 0.0082%(+0.614)#89 |
| 90. | Anchorage | 0.61% | 1.70%(-1.09)#50 | 0.0082%(+0.606)#90 |
| 91. | Bothell West | 0.61% | 0.082%(+0.532)#14 | 0.0082%(+0.606)#91 |
| 92. | Bothell | 0.60% | 0.082%(+0.521)#15 | 0.0082%(+0.595)#92 |
| 93. | Lakeside | 0.60% | 0.034%(+0.565)#5 | 0.0082%(+0.590)#93 |
| 94. | Waite Park | 0.58% | 0.0040%(+0.575)#1 | 0.0082%(+0.571)#94 |
| 95. | Waimea Cdp Hawaii County | 0.57% | 0.025%(+0.549)#3 | 0.0082%(+0.566)#95 |
| 96. | Arapahoe | 0.56% | 0.011%(+0.553)#2 | 0.0082%(+0.556)#96 |
| 97. | Peaceful Valley | 0.55% | 0.082%(+0.470)#16 | 0.0082%(+0.544)#97 |
| 98. | Sudden Valley | 0.55% | 0.082%(+0.467)#17 | 0.0082%(+0.541)#98 |
| 99. | Galena | 0.54% | 0.0042%(+0.539)#1 | 0.0082%(+0.534)#99 |
| 100. | Meadow Lakes | 0.54% | 1.70%(-1.17)#51 | 0.0082%(+0.528)#100 |
Common Questions
What are the Top 10 Cities with the Highest Percentage of Tlingit-Haida Population in the United States?
Top 10 Cities with the Highest Percentage of Tlingit-Haida Population in the United States are:
What city has the Highest Percentage of Tlingit-Haida Population in the United States?
Angoon has the Highest Percentage of Tlingit-Haida Population in the United States with 76.85%.
What is the Percentage of Tlingit-Haida Population in the United States?
Percentage of Tlingit-Haida Population in the United States is 0.0082%.