Cities with the Highest Percentage of Spaniard Population in New York
RELATED REPORTS & OPTIONS
Spaniard
New York
Compare Cities
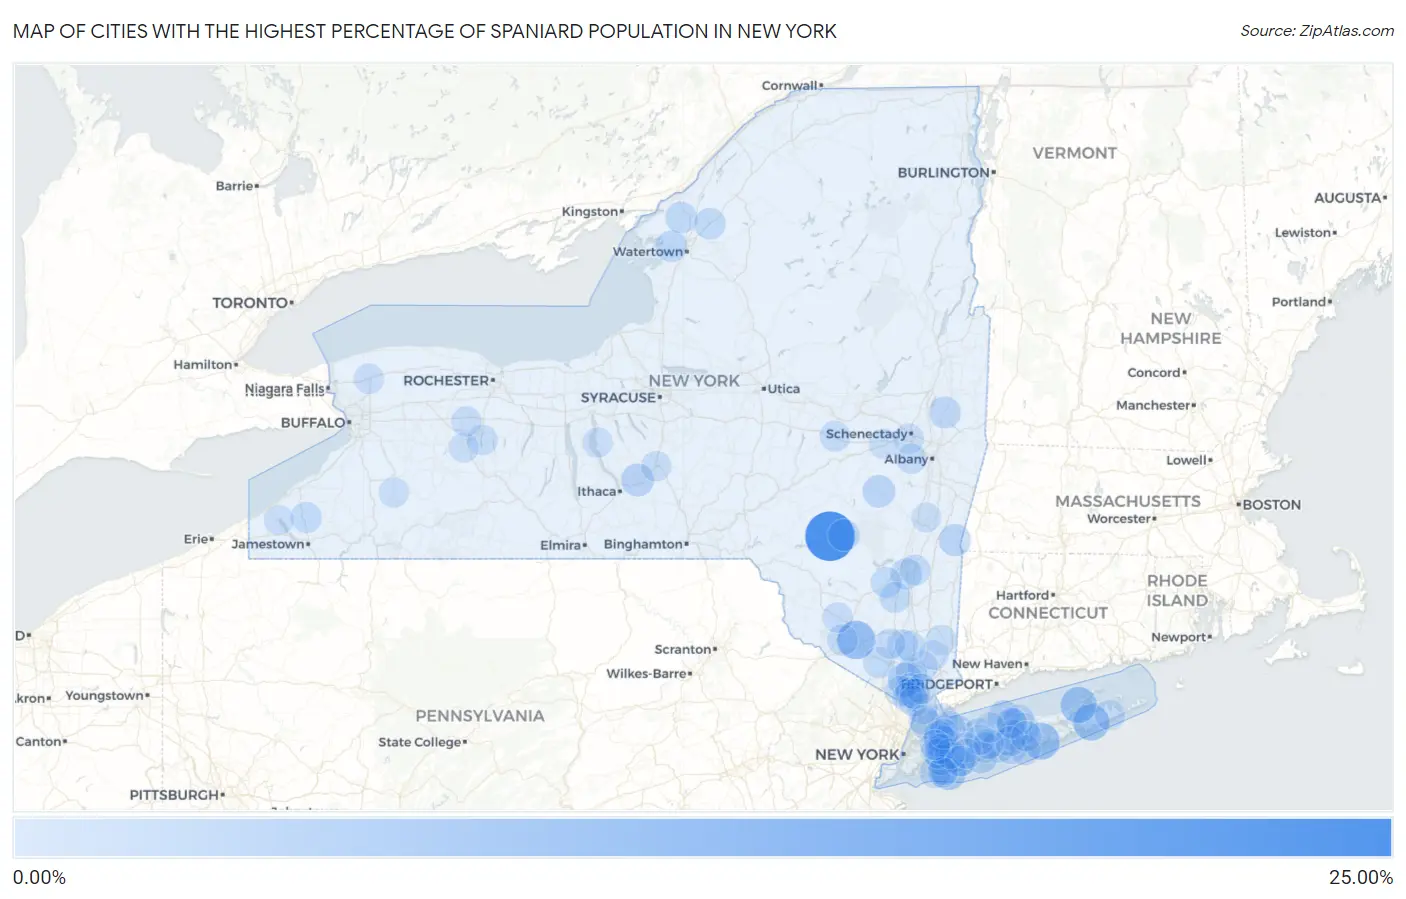
Map of Cities with the Highest Percentage of Spaniard Population in New York
0.00%
25.00%
Cities with the Highest Percentage of Spaniard Population in New York
| City | Spaniard | vs State | vs National | |
| 1. | Margaretville | 20.73% | 0.29%(+20.4)#1 | 0.29%(+20.4)#39 |
| 2. | Washington Heights | 8.84% | 0.29%(+8.56)#2 | 0.29%(+8.56)#132 |
| 3. | Center Moriches | 7.45% | 0.29%(+7.17)#3 | 0.29%(+7.17)#168 |
| 4. | Water Mill | 6.80% | 0.29%(+6.52)#4 | 0.29%(+6.52)#198 |
| 5. | Peconic | 6.68% | 0.29%(+6.40)#5 | 0.29%(+6.40)#201 |
| 6. | Lido Beach | 5.62% | 0.29%(+5.34)#6 | 0.29%(+5.34)#241 |
| 7. | West Haverstraw | 4.40% | 0.29%(+4.12)#7 | 0.29%(+4.12)#320 |
| 8. | Wingdale | 4.10% | 0.29%(+3.82)#8 | 0.29%(+3.82)#351 |
| 9. | Wassaic | 3.43% | 0.29%(+3.15)#9 | 0.29%(+3.15)#418 |
| 10. | Freeville | 3.42% | 0.29%(+3.13)#10 | 0.29%(+3.13)#422 |
| 11. | Preston Potter Hollow | 3.22% | 0.29%(+2.93)#11 | 0.29%(+2.93)#448 |
| 12. | Munsey Park | 3.19% | 0.29%(+2.90)#12 | 0.29%(+2.90)#452 |
| 13. | North Great River | 2.99% | 0.29%(+2.70)#13 | 0.29%(+2.70)#491 |
| 14. | Taconic Shores | 2.76% | 0.29%(+2.48)#14 | 0.29%(+2.47)#541 |
| 15. | Old Field | 2.75% | 0.29%(+2.46)#15 | 0.29%(+2.46)#549 |
| 16. | Highland-On-The-Lake | 2.68% | 0.29%(+2.39)#16 | 0.29%(+2.39)#566 |
| 17. | Oyster Bay | 2.58% | 0.29%(+2.29)#17 | 0.29%(+2.29)#584 |
| 18. | Stillwater | 2.51% | 0.29%(+2.22)#18 | 0.29%(+2.22)#594 |
| 19. | Dexter | 2.49% | 0.29%(+2.20)#19 | 0.29%(+2.20)#598 |
| 20. | Montrose | 2.47% | 0.29%(+2.18)#20 | 0.29%(+2.18)#602 |
| 21. | Rosendale | 2.44% | 0.29%(+2.16)#21 | 0.29%(+2.16)#609 |
| 22. | Babylon | 2.40% | 0.29%(+2.12)#22 | 0.29%(+2.12)#617 |
| 23. | Fleischmanns | 2.31% | 0.29%(+2.02)#23 | 0.29%(+2.02)#643 |
| 24. | La Fargeville | 2.26% | 0.29%(+1.98)#24 | 0.29%(+1.98)#658 |
| 25. | Philadelphia | 2.08% | 0.29%(+1.79)#25 | 0.29%(+1.79)#726 |
| 26. | Elwood | 2.07% | 0.29%(+1.78)#26 | 0.29%(+1.78)#731 |
| 27. | Port Ewen | 1.98% | 0.29%(+1.69)#27 | 0.29%(+1.69)#767 |
| 28. | Sinclairville | 1.85% | 0.29%(+1.56)#28 | 0.29%(+1.56)#820 |
| 29. | Middle Island | 1.83% | 0.29%(+1.54)#29 | 0.29%(+1.54)#832 |
| 30. | Atlantic Beach | 1.82% | 0.29%(+1.53)#30 | 0.29%(+1.53)#835 |
| 31. | Walton Park | 1.81% | 0.29%(+1.53)#31 | 0.29%(+1.53)#836 |
| 32. | Stone Ridge | 1.68% | 0.29%(+1.40)#32 | 0.29%(+1.40)#898 |
| 33. | New Paltz | 1.67% | 0.29%(+1.38)#33 | 0.29%(+1.38)#905 |
| 34. | Cornwall On Hudson | 1.64% | 0.29%(+1.36)#34 | 0.29%(+1.36)#914 |
| 35. | Pelham | 1.64% | 0.29%(+1.35)#35 | 0.29%(+1.35)#919 |
| 36. | Bellerose | 1.60% | 0.29%(+1.32)#36 | 0.29%(+1.32)#941 |
| 37. | Sharon Springs | 1.58% | 0.29%(+1.30)#37 | 0.29%(+1.30)#961 |
| 38. | Miller Place | 1.58% | 0.29%(+1.29)#38 | 0.29%(+1.29)#964 |
| 39. | Otisville | 1.54% | 0.29%(+1.25)#39 | 0.29%(+1.25)#990 |
| 40. | Congers | 1.51% | 0.29%(+1.22)#40 | 0.29%(+1.22)#1,000 |
| 41. | Rhinebeck | 1.49% | 0.29%(+1.20)#41 | 0.29%(+1.20)#1,014 |
| 42. | Valley Cottage | 1.44% | 0.29%(+1.16)#42 | 0.29%(+1.16)#1,036 |
| 43. | Farmingville | 1.42% | 0.29%(+1.13)#43 | 0.29%(+1.13)#1,059 |
| 44. | Bayport | 1.32% | 0.29%(+1.04)#44 | 0.29%(+1.04)#1,133 |
| 45. | Rye | 1.28% | 0.29%(+0.992)#45 | 0.29%(+0.991)#1,170 |
| 46. | Conesus Lake | 1.25% | 0.29%(+0.962)#46 | 0.29%(+0.961)#1,195 |
| 47. | Roslyn | 1.23% | 0.29%(+0.944)#47 | 0.29%(+0.944)#1,218 |
| 48. | Baxter Estates | 1.22% | 0.29%(+0.934)#48 | 0.29%(+0.934)#1,232 |
| 49. | Baywood | 1.21% | 0.29%(+0.926)#49 | 0.29%(+0.925)#1,243 |
| 50. | Hillcrest | 1.19% | 0.29%(+0.901)#50 | 0.29%(+0.900)#1,266 |
| 51. | Crompond | 1.18% | 0.29%(+0.891)#51 | 0.29%(+0.890)#1,272 |
| 52. | North Merrick | 1.17% | 0.29%(+0.888)#52 | 0.29%(+0.887)#1,276 |
| 53. | Rotterdam | 1.13% | 0.29%(+0.844)#53 | 0.29%(+0.843)#1,327 |
| 54. | Lockport | 1.12% | 0.29%(+0.839)#54 | 0.29%(+0.839)#1,334 |
| 55. | Fowlerville | 1.12% | 0.29%(+0.838)#55 | 0.29%(+0.838)#1,337 |
| 56. | Garden City Park | 1.12% | 0.29%(+0.834)#56 | 0.29%(+0.833)#1,343 |
| 57. | Ardsley | 1.10% | 0.29%(+0.812)#57 | 0.29%(+0.811)#1,376 |
| 58. | Voorheesville | 1.09% | 0.29%(+0.806)#58 | 0.29%(+0.806)#1,382 |
| 59. | Rock Hill | 1.09% | 0.29%(+0.805)#59 | 0.29%(+0.805)#1,385 |
| 60. | Bellport | 1.08% | 0.29%(+0.799)#60 | 0.29%(+0.799)#1,392 |
| 61. | Terryville | 1.08% | 0.29%(+0.798)#61 | 0.29%(+0.798)#1,394 |
| 62. | Lattingtown | 1.08% | 0.29%(+0.794)#62 | 0.29%(+0.793)#1,399 |
| 63. | East Hampton North | 1.07% | 0.29%(+0.789)#63 | 0.29%(+0.788)#1,405 |
| 64. | Beaver Dam Lake | 1.06% | 0.29%(+0.777)#64 | 0.29%(+0.776)#1,419 |
| 65. | West Nyack | 1.06% | 0.29%(+0.776)#65 | 0.29%(+0.776)#1,420 |
| 66. | Malverne | 1.06% | 0.29%(+0.770)#66 | 0.29%(+0.770)#1,428 |
| 67. | Cortland | 1.02% | 0.29%(+0.739)#67 | 0.29%(+0.738)#1,481 |
| 68. | Seaford | 1.02% | 0.29%(+0.737)#68 | 0.29%(+0.736)#1,484 |
| 69. | Port Jefferson Station | 1.02% | 0.29%(+0.731)#69 | 0.29%(+0.730)#1,487 |
| 70. | Island Park | 0.97% | 0.29%(+0.685)#70 | 0.29%(+0.685)#1,551 |
| 71. | Holbrook | 0.97% | 0.29%(+0.685)#71 | 0.29%(+0.684)#1,553 |
| 72. | Latham | 0.97% | 0.29%(+0.681)#72 | 0.29%(+0.681)#1,560 |
| 73. | Lake Carmel | 0.96% | 0.29%(+0.679)#73 | 0.29%(+0.678)#1,565 |
| 74. | Yaphank | 0.96% | 0.29%(+0.678)#74 | 0.29%(+0.677)#1,568 |
| 75. | Briarcliff Manor | 0.96% | 0.29%(+0.675)#75 | 0.29%(+0.674)#1,569 |
| 76. | Grand View On Hudson | 0.94% | 0.29%(+0.658)#76 | 0.29%(+0.658)#1,591 |
| 77. | South Floral Park | 0.93% | 0.29%(+0.648)#77 | 0.29%(+0.648)#1,607 |
| 78. | North New Hyde Park | 0.93% | 0.29%(+0.643)#78 | 0.29%(+0.642)#1,619 |
| 79. | Lime Lake | 0.93% | 0.29%(+0.642)#79 | 0.29%(+0.641)#1,620 |
| 80. | Delanson | 0.91% | 0.29%(+0.627)#80 | 0.29%(+0.626)#1,646 |
| 81. | Nelsonville | 0.89% | 0.29%(+0.605)#81 | 0.29%(+0.604)#1,682 |
| 82. | Upper Nyack | 0.89% | 0.29%(+0.602)#82 | 0.29%(+0.601)#1,690 |
| 83. | Wantagh | 0.88% | 0.29%(+0.598)#83 | 0.29%(+0.598)#1,696 |
| 84. | Bronxville | 0.88% | 0.29%(+0.598)#84 | 0.29%(+0.597)#1,698 |
| 85. | Old Bethpage | 0.88% | 0.29%(+0.597)#85 | 0.29%(+0.597)#1,699 |
| 86. | Uniondale | 0.88% | 0.29%(+0.591)#86 | 0.29%(+0.591)#1,708 |
| 87. | Sea Cliff | 0.87% | 0.29%(+0.584)#87 | 0.29%(+0.583)#1,723 |
| 88. | Aurora | 0.87% | 0.29%(+0.582)#88 | 0.29%(+0.581)#1,727 |
| 89. | Dix Hills | 0.86% | 0.29%(+0.579)#89 | 0.29%(+0.578)#1,729 |
| 90. | South Farmingdale | 0.86% | 0.29%(+0.573)#90 | 0.29%(+0.573)#1,740 |
| 91. | Bard College | 0.84% | 0.29%(+0.553)#91 | 0.29%(+0.553)#1,777 |
| 92. | Long Beach | 0.84% | 0.29%(+0.553)#92 | 0.29%(+0.552)#1,780 |
| 93. | Mount Morris | 0.84% | 0.29%(+0.551)#93 | 0.29%(+0.551)#1,781 |
| 94. | Mahopac | 0.83% | 0.29%(+0.547)#94 | 0.29%(+0.546)#1,794 |
| 95. | Athens | 0.82% | 0.29%(+0.538)#95 | 0.29%(+0.538)#1,805 |
| 96. | University Gardens | 0.82% | 0.29%(+0.530)#96 | 0.29%(+0.529)#1,825 |
| 97. | Mayville | 0.81% | 0.29%(+0.527)#97 | 0.29%(+0.526)#1,832 |
| 98. | Macdonnell Heights | 0.80% | 0.29%(+0.516)#98 | 0.29%(+0.515)#1,848 |
| 99. | Brentwood | 0.80% | 0.29%(+0.514)#99 | 0.29%(+0.514)#1,853 |
| 100. | Kings Park | 0.78% | 0.29%(+0.498)#100 | 0.29%(+0.497)#1,893 |
Common Questions
What are the Top 10 Cities with the Highest Percentage of Spaniard Population in New York?
Top 10 Cities with the Highest Percentage of Spaniard Population in New York are:
#1
20.73%
#2
8.84%
#3
7.45%
#4
6.80%
#5
6.68%
#6
5.62%
#7
4.40%
#8
3.42%
#9
3.22%
#10
3.19%
What city has the Highest Percentage of Spaniard Population in New York?
Margaretville has the Highest Percentage of Spaniard Population in New York with 20.73%.
What is the Percentage of Spaniard Population in the State of New York?
Percentage of Spaniard Population in New York is 0.29%.
What is the Percentage of Spaniard Population in the United States?
Percentage of Spaniard Population in the United States is 0.29%.