Cities with the Highest Percentage of Immigrants from Japan in Illinois
RELATED REPORTS & OPTIONS
Japan
Illinois
Compare Cities
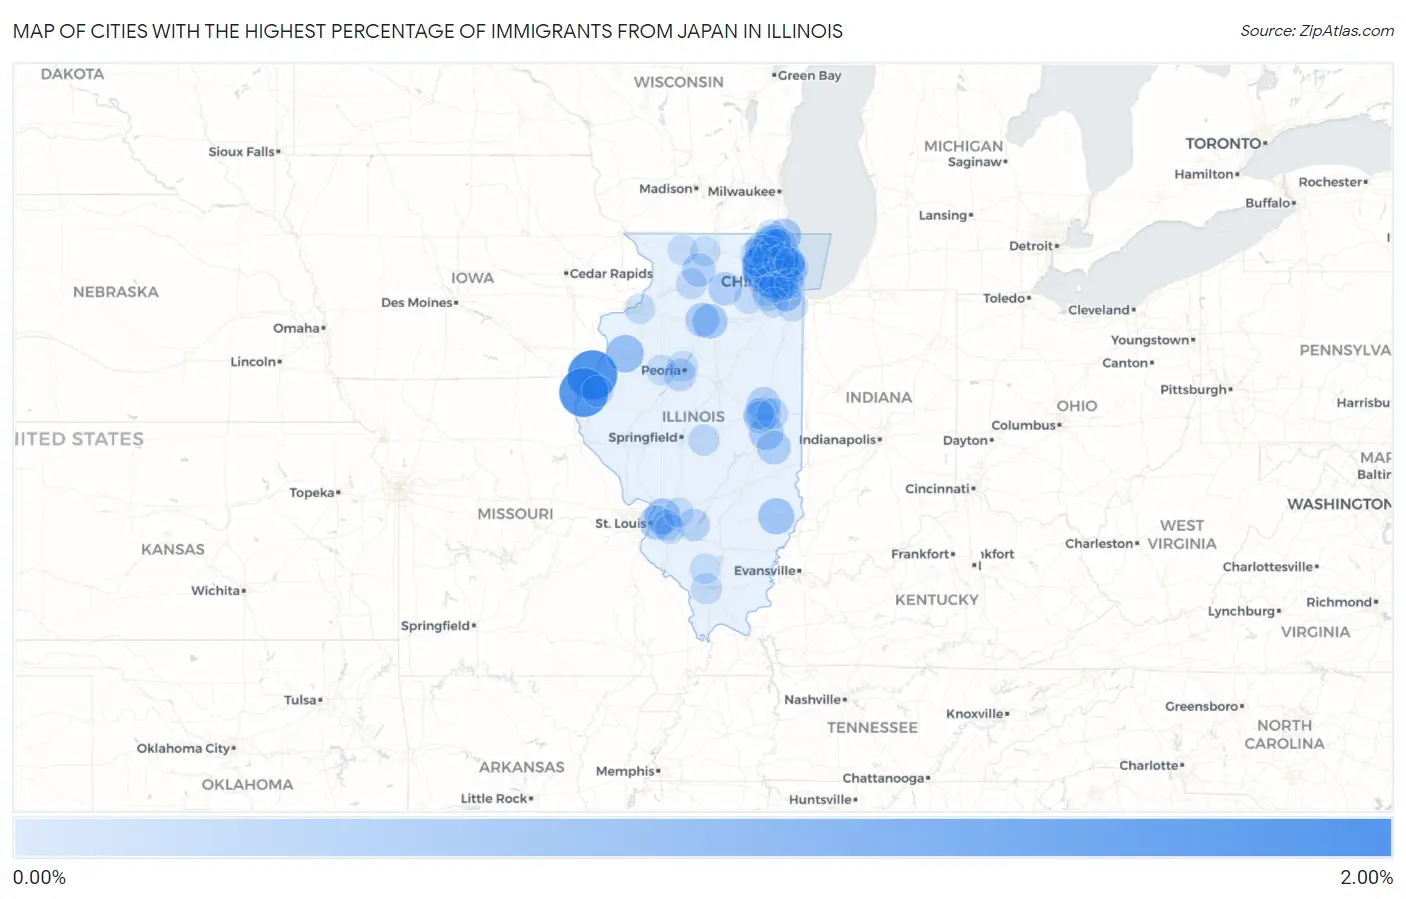
Map of Cities with the Highest Percentage of Immigrants from Japan in Illinois
0.00%
2.00%
Cities with the Highest Percentage of Immigrants from Japan in Illinois
| City | Japan | vs State | vs National | |
| 1. | Pontoosuc | 1.92% | 0.086%(+1.84)#1 | 0.10%(+1.82)#103 |
| 2. | Hamilton | 1.86% | 0.086%(+1.77)#2 | 0.10%(+1.76)#108 |
| 3. | Itasca | 1.82% | 0.086%(+1.73)#3 | 0.10%(+1.71)#112 |
| 4. | Hoffman Estates | 1.65% | 0.086%(+1.57)#4 | 0.10%(+1.55)#132 |
| 5. | Schaumburg | 1.25% | 0.086%(+1.16)#5 | 0.10%(+1.14)#213 |
| 6. | Rolling Meadows | 1.15% | 0.086%(+1.07)#6 | 0.10%(+1.05)#236 |
| 7. | Arlington Heights | 0.84% | 0.086%(+0.750)#7 | 0.10%(+0.733)#353 |
| 8. | Palatine | 0.77% | 0.086%(+0.683)#8 | 0.10%(+0.666)#408 |
| 9. | Monmouth | 0.76% | 0.086%(+0.679)#9 | 0.10%(+0.661)#410 |
| 10. | Claremont | 0.63% | 0.086%(+0.543)#10 | 0.10%(+0.526)#498 |
| 11. | Maryville | 0.58% | 0.086%(+0.498)#11 | 0.10%(+0.481)#552 |
| 12. | Bannockburn | 0.56% | 0.086%(+0.478)#12 | 0.10%(+0.460)#573 |
| 13. | Lake Barrington | 0.56% | 0.086%(+0.472)#13 | 0.10%(+0.455)#584 |
| 14. | Buffalo Grove | 0.56% | 0.086%(+0.471)#14 | 0.10%(+0.453)#587 |
| 15. | Zion | 0.55% | 0.086%(+0.468)#15 | 0.10%(+0.450)#592 |
| 16. | Inverness | 0.53% | 0.086%(+0.445)#16 | 0.10%(+0.428)#620 |
| 17. | Peru | 0.51% | 0.086%(+0.423)#17 | 0.10%(+0.405)#647 |
| 18. | Lincolnshire | 0.51% | 0.086%(+0.420)#18 | 0.10%(+0.402)#656 |
| 19. | Villa Grove | 0.50% | 0.086%(+0.411)#19 | 0.10%(+0.393)#674 |
| 20. | Elk Grove Village | 0.49% | 0.086%(+0.403)#20 | 0.10%(+0.386)#686 |
| 21. | Seatonville | 0.46% | 0.086%(+0.377)#21 | 0.10%(+0.360)#726 |
| 22. | Northfield | 0.46% | 0.086%(+0.370)#22 | 0.10%(+0.352)#738 |
| 23. | Washington Park | 0.45% | 0.086%(+0.365)#23 | 0.10%(+0.348)#748 |
| 24. | Wayne | 0.45% | 0.086%(+0.364)#24 | 0.10%(+0.346)#751 |
| 25. | Holiday Hills | 0.44% | 0.086%(+0.358)#25 | 0.10%(+0.340)#763 |
| 26. | Oakland | 0.43% | 0.086%(+0.346)#26 | 0.10%(+0.329)#783 |
| 27. | Lincolnwood | 0.42% | 0.086%(+0.336)#27 | 0.10%(+0.319)#802 |
| 28. | Urbana | 0.39% | 0.086%(+0.309)#28 | 0.10%(+0.292)#850 |
| 29. | Thomasboro | 0.39% | 0.086%(+0.305)#29 | 0.10%(+0.288)#856 |
| 30. | Shabbona | 0.38% | 0.086%(+0.295)#30 | 0.10%(+0.277)#873 |
| 31. | Oregon | 0.38% | 0.086%(+0.293)#31 | 0.10%(+0.275)#879 |
| 32. | Bloomingdale | 0.34% | 0.086%(+0.257)#32 | 0.10%(+0.240)#954 |
| 33. | Lake Zurich | 0.33% | 0.086%(+0.248)#33 | 0.10%(+0.231)#980 |
| 34. | Rosemont | 0.31% | 0.086%(+0.225)#34 | 0.10%(+0.207)#1,035 |
| 35. | Savoy | 0.30% | 0.086%(+0.214)#35 | 0.10%(+0.196)#1,066 |
| 36. | Beckemeyer | 0.29% | 0.086%(+0.202)#36 | 0.10%(+0.184)#1,110 |
| 37. | Bartonville | 0.29% | 0.086%(+0.200)#37 | 0.10%(+0.182)#1,116 |
| 38. | Grayslake | 0.26% | 0.086%(+0.179)#38 | 0.10%(+0.161)#1,191 |
| 39. | Northbrook | 0.25% | 0.086%(+0.166)#39 | 0.10%(+0.148)#1,246 |
| 40. | Evanston | 0.25% | 0.086%(+0.163)#40 | 0.10%(+0.145)#1,262 |
| 41. | Streamwood | 0.23% | 0.086%(+0.147)#41 | 0.10%(+0.129)#1,334 |
| 42. | Oak Park | 0.23% | 0.086%(+0.141)#42 | 0.10%(+0.123)#1,365 |
| 43. | Lindenhurst | 0.22% | 0.086%(+0.129)#43 | 0.10%(+0.112)#1,423 |
| 44. | Round Lake | 0.21% | 0.086%(+0.128)#44 | 0.10%(+0.111)#1,429 |
| 45. | Park Ridge | 0.21% | 0.086%(+0.128)#45 | 0.10%(+0.110)#1,433 |
| 46. | Vernon Hills | 0.21% | 0.086%(+0.127)#46 | 0.10%(+0.110)#1,436 |
| 47. | Bolingbrook | 0.21% | 0.086%(+0.127)#47 | 0.10%(+0.109)#1,437 |
| 48. | Gurnee | 0.21% | 0.086%(+0.123)#48 | 0.10%(+0.106)#1,451 |
| 49. | Grandwood Park | 0.20% | 0.086%(+0.118)#49 | 0.10%(+0.101)#1,472 |
| 50. | St Joseph | 0.20% | 0.086%(+0.118)#50 | 0.10%(+0.100)#1,474 |
| 51. | Carthage | 0.20% | 0.086%(+0.110)#51 | 0.10%(+0.092)#1,519 |
| 52. | Highland Park | 0.20% | 0.086%(+0.110)#52 | 0.10%(+0.092)#1,520 |
| 53. | Worth | 0.19% | 0.086%(+0.108)#53 | 0.10%(+0.090)#1,534 |
| 54. | West Dundee | 0.19% | 0.086%(+0.105)#54 | 0.10%(+0.088)#1,546 |
| 55. | Mount Auburn | 0.19% | 0.086%(+0.104)#55 | 0.10%(+0.086)#1,563 |
| 56. | Park City | 0.18% | 0.086%(+0.096)#56 | 0.10%(+0.078)#1,600 |
| 57. | Skokie | 0.18% | 0.086%(+0.095)#57 | 0.10%(+0.077)#1,608 |
| 58. | O Fallon | 0.18% | 0.086%(+0.092)#58 | 0.10%(+0.074)#1,624 |
| 59. | Carbondale | 0.17% | 0.086%(+0.087)#59 | 0.10%(+0.069)#1,651 |
| 60. | Mount Prospect | 0.17% | 0.086%(+0.085)#60 | 0.10%(+0.067)#1,663 |
| 61. | Dixon | 0.17% | 0.086%(+0.081)#61 | 0.10%(+0.064)#1,683 |
| 62. | Wood Dale | 0.17% | 0.086%(+0.080)#62 | 0.10%(+0.062)#1,690 |
| 63. | Champaign | 0.16% | 0.086%(+0.078)#63 | 0.10%(+0.060)#1,707 |
| 64. | Prairie Grove | 0.15% | 0.086%(+0.067)#64 | 0.10%(+0.049)#1,783 |
| 65. | South Elgin | 0.15% | 0.086%(+0.065)#65 | 0.10%(+0.048)#1,795 |
| 66. | Wheaton | 0.15% | 0.086%(+0.063)#66 | 0.10%(+0.046)#1,814 |
| 67. | Round Lake Heights | 0.15% | 0.086%(+0.063)#67 | 0.10%(+0.045)#1,817 |
| 68. | Morton Grove | 0.15% | 0.086%(+0.063)#68 | 0.10%(+0.045)#1,820 |
| 69. | Hinsdale | 0.15% | 0.086%(+0.060)#69 | 0.10%(+0.042)#1,840 |
| 70. | Glendale Heights | 0.15% | 0.086%(+0.059)#70 | 0.10%(+0.042)#1,847 |
| 71. | Long Grove | 0.14% | 0.086%(+0.059)#71 | 0.10%(+0.042)#1,849 |
| 72. | Peoria | 0.14% | 0.086%(+0.058)#72 | 0.10%(+0.040)#1,857 |
| 73. | Farmington | 0.14% | 0.086%(+0.057)#73 | 0.10%(+0.040)#1,860 |
| 74. | Du Quoin | 0.14% | 0.086%(+0.052)#74 | 0.10%(+0.034)#1,916 |
| 75. | Antioch | 0.14% | 0.086%(+0.050)#75 | 0.10%(+0.033)#1,929 |
| 76. | Hawthorn Woods | 0.13% | 0.086%(+0.046)#76 | 0.10%(+0.028)#1,956 |
| 77. | Flossmoor | 0.13% | 0.086%(+0.042)#77 | 0.10%(+0.024)#1,987 |
| 78. | Palos Heights | 0.13% | 0.086%(+0.040)#78 | 0.10%(+0.022)#2,010 |
| 79. | Island Lake | 0.12% | 0.086%(+0.039)#79 | 0.10%(+0.021)#2,015 |
| 80. | East Moline | 0.12% | 0.086%(+0.038)#80 | 0.10%(+0.021)#2,017 |
| 81. | Carol Stream | 0.12% | 0.086%(+0.035)#81 | 0.10%(+0.018)#2,044 |
| 82. | Carpentersville | 0.12% | 0.086%(+0.033)#82 | 0.10%(+0.016)#2,062 |
| 83. | Wilmette | 0.12% | 0.086%(+0.033)#83 | 0.10%(+0.015)#2,066 |
| 84. | Western Springs | 0.12% | 0.086%(+0.032)#84 | 0.10%(+0.015)#2,073 |
| 85. | Barrington | 0.12% | 0.086%(+0.030)#85 | 0.10%(+0.012)#2,103 |
| 86. | Deerfield | 0.11% | 0.086%(+0.029)#86 | 0.10%(+0.011)#2,107 |
| 87. | Gages Lake | 0.11% | 0.086%(+0.024)#87 | 0.10%(+0.007)#2,158 |
| 88. | Yorkville | 0.10% | 0.086%(+0.018)#88 | 0.10%(+0.000)#2,220 |
| 89. | Brookfield | 0.10% | 0.086%(+0.018)#89 | 0.10%(-0.000)#2,221 |
| 90. | Freeport | 0.10% | 0.086%(+0.015)#90 | 0.10%(-0.003)#2,264 |
| 91. | Winnebago | 0.100% | 0.086%(+0.014)#91 | 0.10%(-0.004)#2,273 |
| 92. | Scott Afb | 0.099% | 0.086%(+0.014)#92 | 0.10%(-0.004)#2,280 |
| 93. | Naperville | 0.095% | 0.086%(+0.009)#93 | 0.10%(-0.008)#2,316 |
| 94. | Crystal Lake | 0.091% | 0.086%(+0.006)#94 | 0.10%(-0.012)#2,352 |
| 95. | Highland | 0.088% | 0.086%(+0.002)#95 | 0.10%(-0.015)#2,388 |
| 96. | Downers Grove | 0.084% | 0.086%(-0.002)#96 | 0.10%(-0.019)#2,441 |
| 97. | Chicago | 0.084% | 0.086%(-0.002)#97 | 0.10%(-0.020)#2,443 |
| 98. | Lockport | 0.080% | 0.086%(-0.005)#98 | 0.10%(-0.023)#2,474 |
| 99. | Wheeling | 0.080% | 0.086%(-0.006)#99 | 0.10%(-0.024)#2,480 |
| 100. | Winnetka | 0.079% | 0.086%(-0.006)#100 | 0.10%(-0.024)#2,486 |
Common Questions
What are the Top 10 Cities with the Highest Percentage of Immigrants from Japan in Illinois?
Top 10 Cities with the Highest Percentage of Immigrants from Japan in Illinois are:
#1
1.92%
#2
1.86%
#3
1.82%
#4
1.65%
#5
1.25%
#6
1.15%
#7
0.84%
#8
0.77%
#9
0.76%
#10
0.63%
What city has the Highest Percentage of Immigrants from Japan in Illinois?
Pontoosuc has the Highest Percentage of Immigrants from Japan in Illinois with 1.92%.
What is the Percentage of Immigrants from Japan in the State of Illinois?
Percentage of Immigrants from Japan in Illinois is 0.086%.
What is the Percentage of Immigrants from Japan in the United States?
Percentage of Immigrants from Japan in the United States is 0.10%.