Cities with the Highest Percentage of Romanian Population in Oklahoma

RELATED REPORTS & OPTIONS

Romanian
Population
Families and Households
Female Fertility
Female Fertility (Unmarried)
Race (Community Size)
Race (Percentage)
Ancestry (Community Size)
AfghanAfricanAlaska NativeAlaskan AthabascanAlbanianAleutAlsatianAmericanApacheArabArapahoArgentineanArmenianAssyrian / Chaldean / SyriacAustralianAustrianBahamianBangladeshiBarbadianBasqueBelgianBelizeanBermudanBhutaneseBlackfeetBolivianBrazilianBritishBritish West IndianBulgarianBurmeseCajunCambodianCanadianCape VerdeanCarpatho RusynCelticCentral AmericanCentral American IndianCherokeeCheyenneChickasawChileanChineseChippewaChoctawColombianColvilleComancheCosta RicanCreeCreekCroatianCrowCubanCypriotCzechCzechoslovakianDanishDelawareDominicanDutchDutch West IndianEastern EuropeanEcuadorianEgyptianEnglishEstonianEthiopianEuropeanFijianFilipinoFinnishFrenchFrench American IndianFrench CanadianGermanGerman RussianGhanaianGreekGuamanian / ChamorroGuatemalanGuyaneseHaitianHmongHonduranHopiHoumaHungarianIcelanderIndian (Asian)IndonesianInupiatIranianIraqiIrishIroquoisIsraeliItalianJamaicanJapaneseJordanianKenyanKiowaKoreanLaotianLatvianLebaneseLiberianLithuanianLumbeeLuxembourgerMacedonianMalaysianMalteseMarshalleseMenomineeMexicanMexican American IndianMongolianMoroccanNative HawaiianNavajoNepaleseNew ZealanderNicaraguanNigerianNorthern EuropeanNorwegianOkinawanOsageOttawaPaiutePakistaniPalestinianPanamanianParaguayanPennsylvania GermanPeruvianPimaPolishPortuguesePotawatomiPuebloPuerto RicanPuget Sound SalishRomanianRussianSalvadoranSamoanScandinavianScotch-IrishScottishSeminoleSenegaleseSerbianShoshoneSierra LeoneanSiouxSlavicSlovakSloveneSomaliSouth AfricanSouth AmericanSouth American IndianSoviet UnionSpaniardSpanishSpanish AmericanSpanish American IndianSri LankanSubsaharan AfricanSudaneseSwedishSwissSyrianTaiwaneseThaiTlingit-HaidaTohono O'OdhamTonganTrinidadian and TobagonianTsimshianTurkishU.S. Virgin IslanderUgandanUkrainianUruguayanUteVenezuelanVietnameseWelshWest IndianYakamaYaquiYugoslavianYumanYup'ikZimbabwean
Ancestry (Percentage)
AfghanAfricanAlaska NativeAlaskan AthabascanAlbanianAleutAlsatianAmericanApacheArabArapahoArgentineanArmenianAssyrian / Chaldean / SyriacAustralianAustrianBahamianBangladeshiBarbadianBasqueBelgianBelizeanBermudanBhutaneseBlackfeetBolivianBrazilianBritishBritish West IndianBulgarianBurmeseCajunCambodianCanadianCape VerdeanCarpatho RusynCelticCentral AmericanCentral American IndianCherokeeCheyenneChickasawChileanChineseChippewaChoctawColombianColvilleComancheCosta RicanCreeCreekCroatianCrowCubanCypriotCzechCzechoslovakianDanishDelawareDominicanDutchDutch West IndianEastern EuropeanEcuadorianEgyptianEnglishEstonianEthiopianEuropeanFijianFilipinoFinnishFrenchFrench American IndianFrench CanadianGermanGerman RussianGhanaianGreekGuamanian / ChamorroGuatemalanGuyaneseHaitianHmongHonduranHopiHoumaHungarianIcelanderIndian (Asian)IndonesianInupiatIranianIraqiIrishIroquoisIsraeliItalianJamaicanJapaneseJordanianKenyanKiowaKoreanLaotianLatvianLebaneseLiberianLithuanianLumbeeLuxembourgerMacedonianMalaysianMalteseMarshalleseMenomineeMexicanMexican American IndianMongolianMoroccanNative HawaiianNavajoNepaleseNew ZealanderNicaraguanNigerianNorthern EuropeanNorwegianOkinawanOsageOttawaPaiutePakistaniPalestinianPanamanianParaguayanPennsylvania GermanPeruvianPimaPolishPortuguesePotawatomiPuebloPuerto RicanPuget Sound SalishRomanianRussianSalvadoranSamoanScandinavianScotch-IrishScottishSeminoleSenegaleseSerbianShoshoneSierra LeoneanSiouxSlavicSlovakSloveneSomaliSouth AfricanSouth AmericanSouth American IndianSoviet UnionSpaniardSpanishSpanish AmericanSpanish American IndianSri LankanSubsaharan AfricanSudaneseSwedishSwissSyrianTaiwaneseThaiTlingit-HaidaTohono O'OdhamTonganTrinidadian and TobagonianTsimshianTurkishU.S. Virgin IslanderUgandanUkrainianUruguayanUteVenezuelanVietnameseWelshWest IndianYakamaYaquiYugoslavianYumanYup'ikZimbabwean
Immigrant Origin (Total)
AfghanistanAfricaAlbaniaArgentinaArmeniaAsiaAustraliaAustriaAzoresBahamasBangladeshBarbadosBelarusBelgiumBelizeBoliviaBosnia and HerzegovinaBrazilBulgariaBurma / MyanmarCabo VerdeCambodiaCameroonCanadaCaribbeanCentral AmericaChileChinaColombiaCongoCosta RicaCroatiaCubaCzechoslovakiaDenmarkDominicaDominican RepublicEastern AfricaEastern AsiaEastern EuropeEcuadorEgyptEl SalvadorEnglandEritreaEthiopiaEuropeFijiFranceGermanyGhanaGreeceGrenadaGuatemalaGuyanaHaitiHondurasHong KongHungaryIndiaIndonesiaIranIraqIrelandIsraelItalyJamaicaJapanJordanKazakhstanKenyaKoreaKuwaitLaosLatin AmericaLatviaLebanonLiberiaLithuaniaMalaysiaMexicoMicronesiaMiddle AfricaMoldovaMoroccoNepalNetherlandsNicaraguaNigeriaNorth MacedoniaNorthern AfricaNorthern EuropeNorwayOceaniaPakistanPanamaPeruPhilippinesPolandPortugalRomaniaRussiaSaudi ArabiaScotlandSenegalSerbiaSierra LeoneSingaporeSomaliaSouth AfricaSouth AmericaSouth Central AsiaSouth Eastern AsiaSouthern EuropeSpainSri LankaSt. Vincent and the GrenadinesSudanSwedenSwitzerlandSyriaTaiwanThailandTrinidad and TobagoTurkeyUgandaUkraineUruguayUzbekistanVenezuelaVietnamWest IndiesWestern AfricaWestern AsiaWestern EuropeYemenZaireZimbabwe
Immigrant Origin (Percentage)
AfghanistanAfricaAlbaniaArgentinaArmeniaAsiaAustraliaAustriaAzoresBahamasBangladeshBarbadosBelarusBelgiumBelizeBoliviaBosnia and HerzegovinaBrazilBulgariaBurma / MyanmarCabo VerdeCambodiaCameroonCanadaCaribbeanCentral AmericaChileChinaColombiaCongoCosta RicaCroatiaCubaCzechoslovakiaDenmarkDominicaDominican RepublicEastern AfricaEastern AsiaEastern EuropeEcuadorEgyptEl SalvadorEnglandEritreaEthiopiaEuropeFijiFranceGermanyGhanaGreeceGrenadaGuatemalaGuyanaHaitiHondurasHong KongHungaryIndiaIndonesiaIranIraqIrelandIsraelItalyJamaicaJapanJordanKazakhstanKenyaKoreaKuwaitLaosLatin AmericaLatviaLebanonLiberiaLithuaniaMalaysiaMexicoMicronesiaMiddle AfricaMoldovaMoroccoNepalNetherlandsNicaraguaNigeriaNorth MacedoniaNorthern AfricaNorthern EuropeNorwayOceaniaPakistanPanamaPeruPhilippinesPolandPortugalRomaniaRussiaSaudi ArabiaScotlandSenegalSerbiaSierra LeoneSingaporeSomaliaSouth AfricaSouth AmericaSouth Central AsiaSouth Eastern AsiaSouthern EuropeSpainSri LankaSt. Vincent and the GrenadinesSudanSwedenSwitzerlandSyriaTaiwanThailandTrinidad and TobagoTurkeyUgandaUkraineUruguayUzbekistanVenezuelaVietnamWest IndiesWestern AfricaWestern AsiaWestern EuropeYemenZaireZimbabwe
Income
Income (Families)
Income (Households)
Poverty
Poverty (Families)
Unemployment
Employment Occupations
Employment Industries
Employer Class
Commute Time
Commute Means
School Enrollment
Education by Degree Field
Occupancy
Finances
Physical Characteristics
Oklahoma
Compare Cities
Comparison Subject

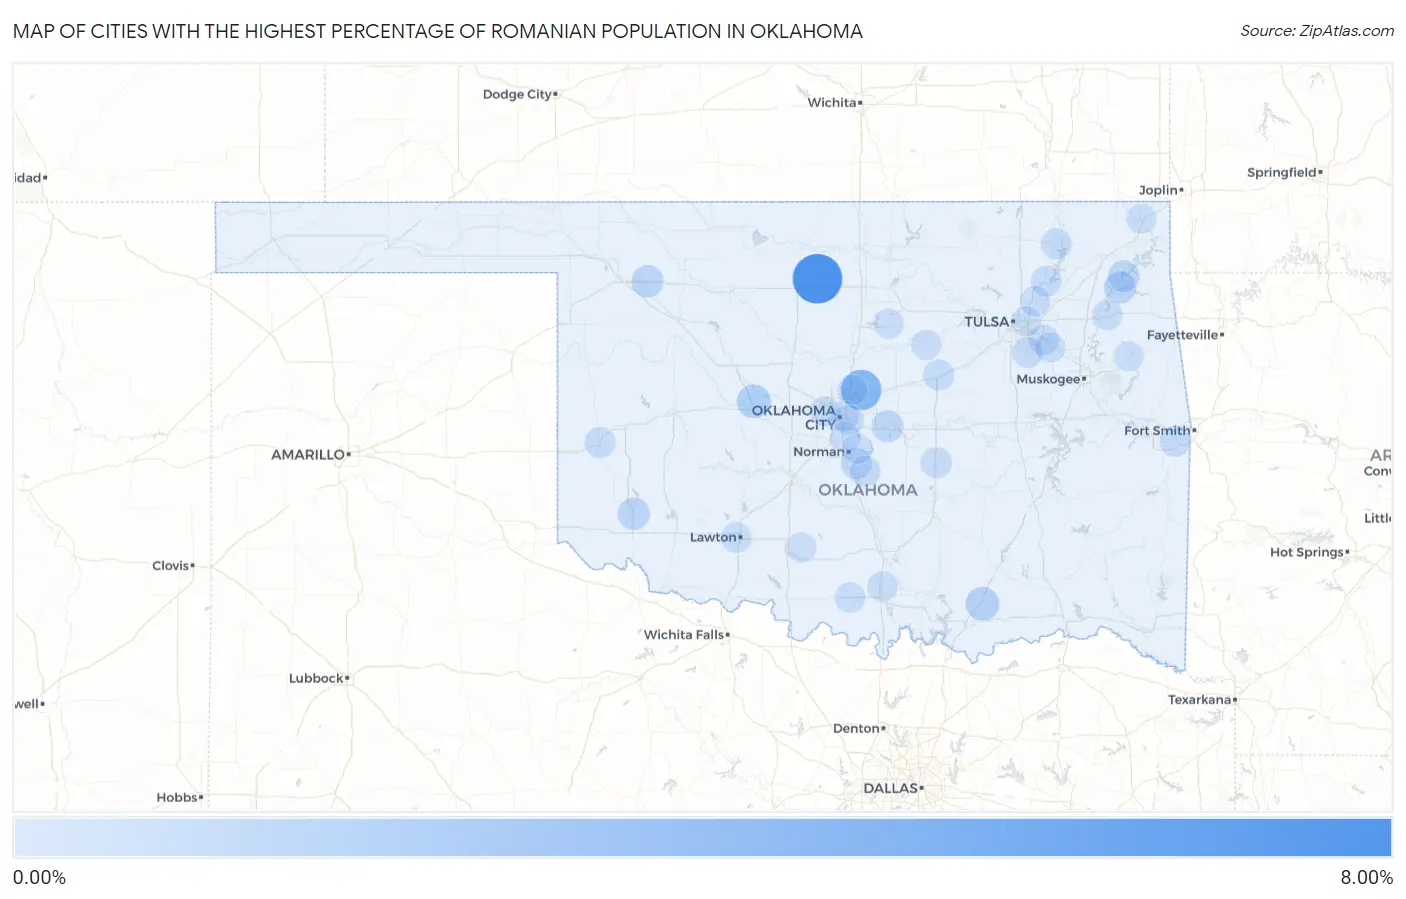
Map of Cities with the Highest Percentage of Romanian Population in Oklahoma

0.00%
8.00%
Cities with the Highest Percentage of Romanian Population in Oklahoma Map

Cities with the Highest Percentage of Romanian Population in Oklahoma

City Romanian vs State vs National
1.Breckenridge7.32%0.040%(+7.28)#10.14%(+7.18)#18
2.Arcadia3.77%0.040%(+3.73)#20.14%(+3.63)#77
3.Geary1.29%0.040%(+1.25)#30.14%(+1.15)#380
4.Caddo1.24%0.040%(+1.20)#40.14%(+1.11)#403
5.Blair0.72%0.040%(+0.681)#50.14%(+0.582)#812
6.Spavinaw0.71%0.040%(+0.670)#60.14%(+0.571)#830
7.Mooreland0.68%0.040%(+0.641)#70.14%(+0.542)#865
8.Mcloud0.66%0.040%(+0.620)#80.14%(+0.521)#902
9.Disney0.56%0.040%(+0.522)#90.14%(+0.423)#1,094
10.Noble0.33%0.040%(+0.295)#100.14%(+0.196)#1,801
11.Stroud0.29%0.040%(+0.251)#110.14%(+0.153)#1,998
12.Nowata0.28%0.040%(+0.243)#120.14%(+0.144)#2,051
13.Bowlegs0.27%0.040%(+0.229)#130.14%(+0.130)#2,148
14.Fort Coffee0.26%0.040%(+0.223)#140.14%(+0.124)#2,199
15.Slaughterville0.24%0.040%(+0.199)#150.14%(+0.100)#2,343
16.Oologah0.22%0.040%(+0.185)#160.14%(+0.086)#2,459
17.Sayre0.22%0.040%(+0.180)#170.14%(+0.081)#2,499
18.Bixby0.21%0.040%(+0.173)#180.14%(+0.074)#2,556
19.Moore0.16%0.040%(+0.118)#190.14%(+0.019)#3,058
20.Locust Grove0.14%0.040%(+0.101)#200.14%(+0.002)#3,222
21.Lawton0.13%0.040%(+0.089)#210.14%(-0.010)#3,322
22.Wilson0.12%0.040%(+0.084)#220.14%(-0.014)#3,376
23.Broken Arrow0.12%0.040%(+0.081)#230.14%(-0.018)#3,414
24.Owasso0.097%0.040%(+0.057)#240.14%(-0.042)#3,678
25.Ardmore0.073%0.040%(+0.033)#250.14%(-0.066)#4,000
26.Duncan0.070%0.040%(+0.031)#260.14%(-0.068)#4,038
27.Tulsa0.070%0.040%(+0.030)#270.14%(-0.069)#4,047
28.Tahlequah0.067%0.040%(+0.027)#280.14%(-0.071)#4,083
29.Norman0.063%0.040%(+0.023)#290.14%(-0.076)#4,136
30.Cushing0.060%0.040%(+0.020)#300.14%(-0.079)#4,165
31.Miami0.046%0.040%(+0.006)#310.14%(-0.092)#4,336
32.Oklahoma City0.041%0.040%(+0.001)#320.14%(-0.098)#4,420
33.Bethany0.034%0.040%(-0.006)#330.14%(-0.105)#4,515
34.Edmond0.034%0.040%(-0.006)#340.14%(-0.105)#4,516
35.Del City0.028%0.040%(-0.012)#350.14%(-0.111)#4,604
36.Stillwater0.012%0.040%(-0.027)#360.14%(-0.126)#4,768
37.Coweta0.010%0.040%(-0.030)#370.14%(-0.129)#4,787

Common Questions

What are the Top 10 Cities with the Highest Percentage of Romanian Population in Oklahoma?
Top 10 Cities with the Highest Percentage of Romanian Population in Oklahoma are:
#1
7.32%
#2
3.77%
#3
1.29%
#4
1.24%
#5
0.72%
#6
0.71%
#7
0.68%
#8
0.66%
#9
0.56%
#10
0.33%
What city has the Highest Percentage of Romanian Population in Oklahoma?
Breckenridge has the Highest Percentage of Romanian Population in Oklahoma with 7.32%.
What is the Percentage of Romanian Population in the State of Oklahoma?
Percentage of Romanian Population in Oklahoma is 0.040%.
What is the Percentage of Romanian Population in the United States?
Percentage of Romanian Population in the United States is 0.14%.