Cities with the Highest Percentage of Romanian Population in Texas
RELATED REPORTS & OPTIONS
Romanian
Texas
Compare Cities
Map of Cities with the Highest Percentage of Romanian Population in Texas
0.00%
60.00%
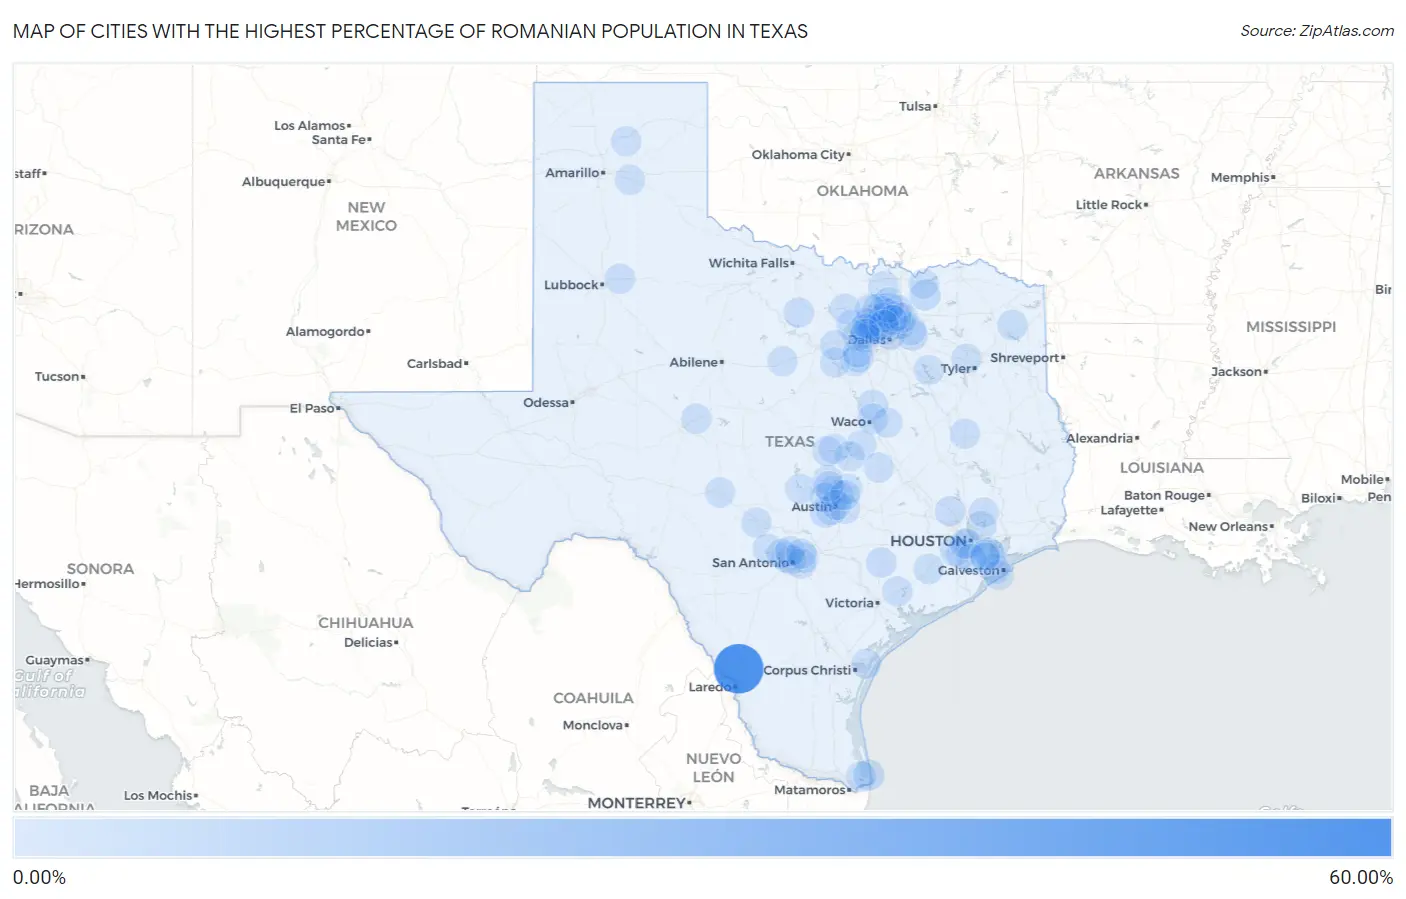
Cities with the Highest Percentage of Romanian Population in Texas
| City | Romanian | vs State | vs National | |
| 1. | Botines | 53.85% | 0.061% (+53.8)#1 | 0.14% (+53.7)#1 |
| 2. | South Padre Island | 2.56% | 0.061% (+2.50)#2 | 0.14% (+2.42)#144 |
| 3. | Bailey | 2.41% | 0.061% (+2.35)#3 | 0.14% (+2.27)#154 |
| 4. | Mclendon Chisholm | 1.97% | 0.061% (+1.91)#4 | 0.14% (+1.83)#214 |
| 5. | Murphy | 1.36% | 0.061% (+1.30)#5 | 0.14% (+1.22)#354 |
| 6. | West | 1.36% | 0.061% (+1.30)#6 | 0.14% (+1.22)#355 |
| 7. | Bear Creek | 1.24% | 0.061% (+1.18)#7 | 0.14% (+1.10)#408 |
| 8. | Bellmead | 1.17% | 0.061% (+1.11)#8 | 0.14% (+1.04)#435 |
| 9. | Hughes Springs | 1.05% | 0.061% (+0.988)#9 | 0.14% (+0.910)#513 |
| 10. | Sunset Valley | 0.71% | 0.061% (+0.651)#10 | 0.14% (+0.573)#827 |
| 11. | Hallettsville | 0.70% | 0.061% (+0.635)#11 | 0.14% (+0.558)#846 |
| 12. | Lorenzo | 0.68% | 0.061% (+0.622)#12 | 0.14% (+0.545)#862 |
| 13. | Center Point | 0.67% | 0.061% (+0.605)#13 | 0.14% (+0.527)#891 |
| 14. | Bryson | 0.66% | 0.061% (+0.598)#14 | 0.14% (+0.520)#905 |
| 15. | Magnolia | 0.61% | 0.061% (+0.550)#15 | 0.14% (+0.472)#992 |
| 16. | Sienna | 0.60% | 0.061% (+0.535)#16 | 0.14% (+0.457)#1,021 |
| 17. | Wharton | 0.58% | 0.061% (+0.516)#17 | 0.14% (+0.438)#1,059 |
| 18. | Coppell | 0.56% | 0.061% (+0.497)#18 | 0.14% (+0.419)#1,107 |
| 19. | Gun Barrel City | 0.48% | 0.061% (+0.419)#19 | 0.14% (+0.342)#1,286 |
| 20. | Double Oak | 0.46% | 0.061% (+0.400)#20 | 0.14% (+0.322)#1,338 |
| 21. | Hideaway | 0.44% | 0.061% (+0.375)#21 | 0.14% (+0.297)#1,416 |
| 22. | Rockwall | 0.43% | 0.061% (+0.374)#22 | 0.14% (+0.296)#1,423 |
| 23. | Pecan Acres | 0.43% | 0.061% (+0.366)#23 | 0.14% (+0.288)#1,443 |
| 24. | Miles | 0.42% | 0.061% (+0.357)#24 | 0.14% (+0.279)#1,468 |
| 25. | Decatur | 0.38% | 0.061% (+0.322)#25 | 0.14% (+0.245)#1,601 |
| 26. | Leon Valley | 0.38% | 0.061% (+0.322)#26 | 0.14% (+0.244)#1,605 |
| 27. | Kemah | 0.36% | 0.061% (+0.299)#27 | 0.14% (+0.221)#1,689 |
| 28. | Cedar Park | 0.35% | 0.061% (+0.291)#28 | 0.14% (+0.214)#1,724 |
| 29. | Kerrville | 0.34% | 0.061% (+0.276)#29 | 0.14% (+0.198)#1,792 |
| 30. | Claude | 0.33% | 0.061% (+0.267)#30 | 0.14% (+0.190)#1,834 |
| 31. | Saginaw | 0.33% | 0.061% (+0.267)#31 | 0.14% (+0.189)#1,839 |
| 32. | Ingleside | 0.32% | 0.061% (+0.258)#32 | 0.14% (+0.181)#1,875 |
| 33. | Lakehills | 0.32% | 0.061% (+0.258)#33 | 0.14% (+0.180)#1,876 |
| 34. | Missouri City | 0.32% | 0.061% (+0.256)#34 | 0.14% (+0.178)#1,893 |
| 35. | Hutto | 0.29% | 0.061% (+0.231)#35 | 0.14% (+0.153)#1,995 |
| 36. | Troy | 0.29% | 0.061% (+0.226)#36 | 0.14% (+0.149)#2,019 |
| 37. | Liberty Hill | 0.28% | 0.061% (+0.224)#37 | 0.14% (+0.146)#2,034 |
| 38. | Latexo | 0.28% | 0.061% (+0.223)#38 | 0.14% (+0.145)#2,039 |
| 39. | Collinsville | 0.28% | 0.061% (+0.223)#39 | 0.14% (+0.145)#2,043 |
| 40. | Laguna Vista | 0.28% | 0.061% (+0.220)#40 | 0.14% (+0.143)#2,054 |
| 41. | Wells Branch | 0.28% | 0.061% (+0.219)#41 | 0.14% (+0.141)#2,072 |
| 42. | Ranger | 0.28% | 0.061% (+0.216)#42 | 0.14% (+0.139)#2,084 |
| 43. | Celina | 0.27% | 0.061% (+0.213)#43 | 0.14% (+0.136)#2,099 |
| 44. | University Park | 0.27% | 0.061% (+0.209)#44 | 0.14% (+0.131)#2,141 |
| 45. | Farmers Branch | 0.27% | 0.061% (+0.206)#45 | 0.14% (+0.128)#2,162 |
| 46. | Bayou Vista | 0.25% | 0.061% (+0.188)#46 | 0.14% (+0.111)#2,280 |
| 47. | Mckinney | 0.24% | 0.061% (+0.178)#47 | 0.14% (+0.100)#2,346 |
| 48. | Joshua | 0.24% | 0.061% (+0.176)#48 | 0.14% (+0.099)#2,358 |
| 49. | Atascocita | 0.24% | 0.061% (+0.176)#49 | 0.14% (+0.098)#2,361 |
| 50. | Cross Roads | 0.23% | 0.061% (+0.172)#50 | 0.14% (+0.094)#2,399 |
| 51. | Burleson | 0.23% | 0.061% (+0.170)#51 | 0.14% (+0.092)#2,413 |
| 52. | Sugar Land | 0.23% | 0.061% (+0.165)#52 | 0.14% (+0.088)#2,445 |
| 53. | Southlake | 0.22% | 0.061% (+0.160)#53 | 0.14% (+0.082)#2,488 |
| 54. | Grapevine | 0.20% | 0.061% (+0.144)#54 | 0.14% (+0.066)#2,616 |
| 55. | Edna | 0.20% | 0.061% (+0.140)#55 | 0.14% (+0.062)#2,652 |
| 56. | West University Place | 0.20% | 0.061% (+0.140)#56 | 0.14% (+0.062)#2,653 |
| 57. | Junction | 0.20% | 0.061% (+0.140)#57 | 0.14% (+0.062)#2,654 |
| 58. | El Lago | 0.20% | 0.061% (+0.136)#58 | 0.14% (+0.059)#2,685 |
| 59. | Frisco | 0.19% | 0.061% (+0.131)#59 | 0.14% (+0.053)#2,736 |
| 60. | Hudson Bend | 0.19% | 0.061% (+0.130)#60 | 0.14% (+0.052)#2,747 |
| 61. | Richland Hills | 0.19% | 0.061% (+0.127)#61 | 0.14% (+0.049)#2,769 |
| 62. | Little Elm | 0.19% | 0.061% (+0.126)#62 | 0.14% (+0.048)#2,789 |
| 63. | Bellaire | 0.19% | 0.061% (+0.125)#63 | 0.14% (+0.048)#2,790 |
| 64. | Mart | 0.18% | 0.061% (+0.123)#64 | 0.14% (+0.045)#2,805 |
| 65. | Galveston | 0.18% | 0.061% (+0.119)#65 | 0.14% (+0.042)#2,842 |
| 66. | Manvel | 0.18% | 0.061% (+0.117)#66 | 0.14% (+0.039)#2,869 |
| 67. | Horseshoe Bay | 0.17% | 0.061% (+0.113)#67 | 0.14% (+0.035)#2,906 |
| 68. | The Colony | 0.17% | 0.061% (+0.111)#68 | 0.14% (+0.033)#2,926 |
| 69. | Cameron | 0.17% | 0.061% (+0.107)#69 | 0.14% (+0.029)#2,968 |
| 70. | Belterra | 0.16% | 0.061% (+0.104)#70 | 0.14% (+0.026)#2,998 |
| 71. | Hornsby Bend | 0.16% | 0.061% (+0.102)#71 | 0.14% (+0.025)#3,012 |
| 72. | Allen | 0.16% | 0.061% (+0.100)#72 | 0.14% (+0.023)#3,023 |
| 73. | Prosper | 0.16% | 0.061% (+0.098)#73 | 0.14% (+0.020)#3,050 |
| 74. | Webster | 0.15% | 0.061% (+0.094)#74 | 0.14% (+0.016)#3,095 |
| 75. | Austin | 0.15% | 0.061% (+0.092)#75 | 0.14% (+0.015)#3,110 |
| 76. | League City | 0.14% | 0.061% (+0.082)#76 | 0.14% (+0.004)#3,202 |
| 77. | Converse | 0.14% | 0.061% (+0.078)#77 | 0.14% (+0.000)#3,236 |
| 78. | Trophy Club | 0.14% | 0.061% (+0.075)#78 | 0.14% (-0.003)#3,261 |
| 79. | Keller | 0.13% | 0.061% (+0.074)#79 | 0.14% (-0.004)#3,273 |
| 80. | Granbury | 0.13% | 0.061% (+0.073)#80 | 0.14% (-0.005)#3,277 |
| 81. | Helotes | 0.13% | 0.061% (+0.070)#81 | 0.14% (-0.007)#3,295 |
| 82. | Weatherford | 0.13% | 0.061% (+0.070)#82 | 0.14% (-0.008)#3,299 |
| 83. | Leander | 0.13% | 0.061% (+0.069)#83 | 0.14% (-0.009)#3,306 |
| 84. | Lucas | 0.13% | 0.061% (+0.068)#84 | 0.14% (-0.010)#3,311 |
| 85. | Pflugerville | 0.13% | 0.061% (+0.066)#85 | 0.14% (-0.012)#3,336 |
| 86. | Fort Hood | 0.13% | 0.061% (+0.065)#86 | 0.14% (-0.013)#3,355 |
| 87. | Belton | 0.13% | 0.061% (+0.064)#87 | 0.14% (-0.013)#3,359 |
| 88. | Denton | 0.12% | 0.061% (+0.063)#88 | 0.14% (-0.014)#3,373 |
| 89. | Bonham | 0.12% | 0.061% (+0.063)#89 | 0.14% (-0.015)#3,381 |
| 90. | China Grove | 0.12% | 0.061% (+0.060)#90 | 0.14% (-0.018)#3,416 |
| 91. | Borger | 0.12% | 0.061% (+0.059)#91 | 0.14% (-0.019)#3,424 |
| 92. | Plano | 0.12% | 0.061% (+0.058)#92 | 0.14% (-0.020)#3,432 |
| 93. | San Antonio | 0.12% | 0.061% (+0.057)#93 | 0.14% (-0.021)#3,450 |
| 94. | Carrollton | 0.11% | 0.061% (+0.053)#94 | 0.14% (-0.024)#3,485 |
| 95. | Shavano Park | 0.11% | 0.061% (+0.052)#95 | 0.14% (-0.026)#3,501 |
| 96. | Copperas Cove | 0.11% | 0.061% (+0.049)#96 | 0.14% (-0.029)#3,541 |
| 97. | Crowley | 0.11% | 0.061% (+0.048)#97 | 0.14% (-0.030)#3,552 |
| 98. | Live Oak | 0.11% | 0.061% (+0.047)#98 | 0.14% (-0.031)#3,561 |
| 99. | North Richland Hills | 0.098% | 0.061% (+0.037)#99 | 0.14% (-0.040)#3,656 |
| 100. | Roman Forest | 0.096% | 0.061% (+0.035)#100 | 0.14% (-0.042)#3,691 |
Common Questions
What are the Top 10 Cities with the Highest Percentage of Romanian Population in Texas?
Top 10 Cities with the Highest Percentage of Romanian Population in Texas are:
#1
53.85%
#2
2.56%
#3
2.41%
#4
1.97%
#5
1.36%
#6
1.36%
#7
1.24%
#8
1.17%
#9
1.05%
#10
0.71%
What city has the Highest Percentage of Romanian Population in Texas?
Botines has the Highest Percentage of Romanian Population in Texas with 53.85%.
What is the Percentage of Romanian Population in the State of Texas?
Percentage of Romanian Population in Texas is 0.061%.
What is the Percentage of Romanian Population in the United States?
Percentage of Romanian Population in the United States is 0.14%.