Cities with the Highest Percentage of Dutch Population in Connecticut
RELATED REPORTS & OPTIONS
Dutch
Connecticut
Compare Cities
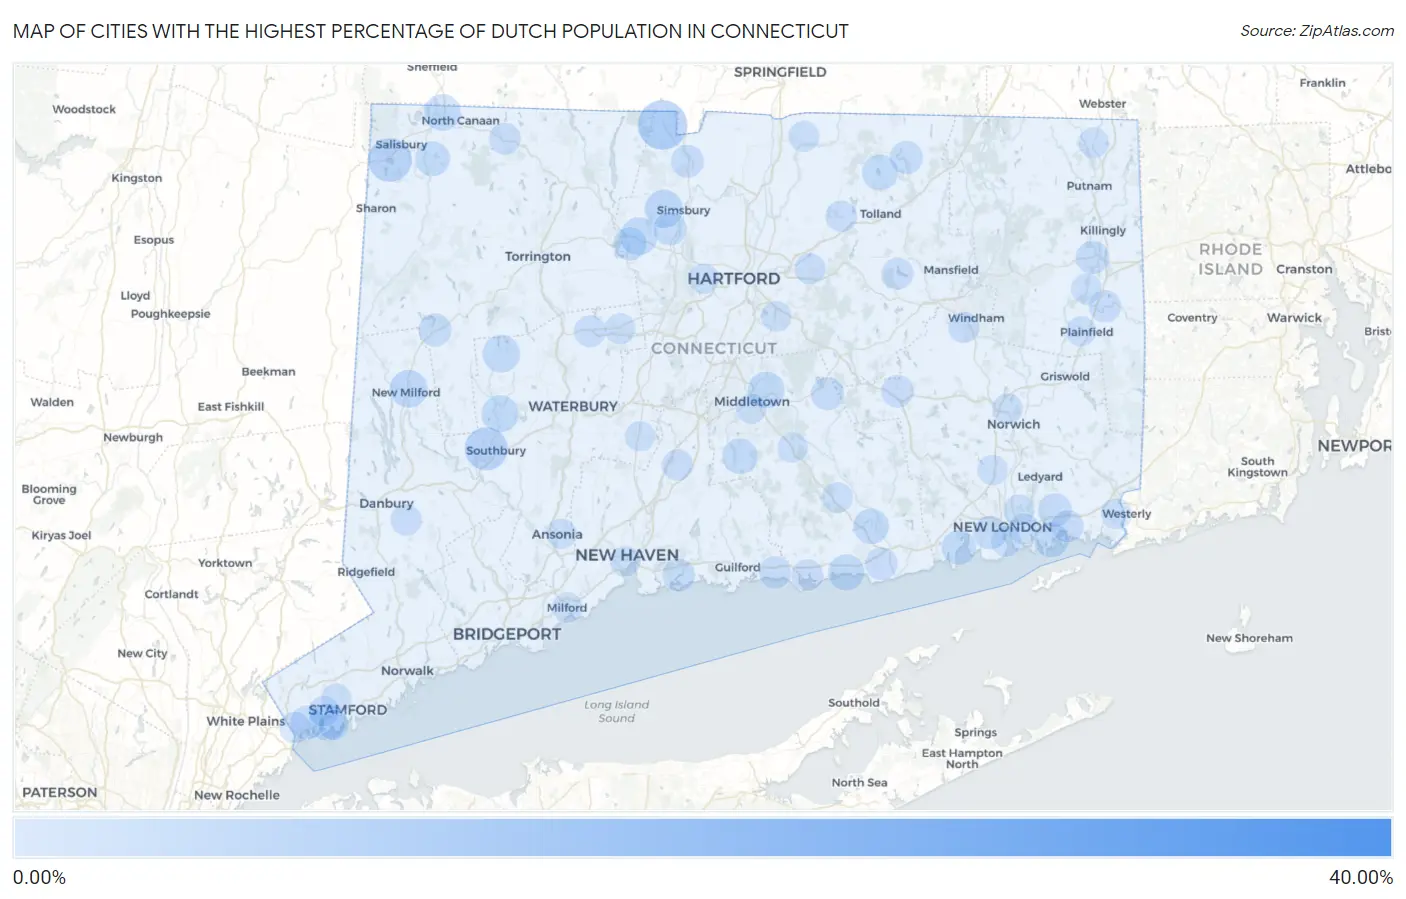
Map of Cities with the Highest Percentage of Dutch Population in Connecticut
0.00%
40.00%
Cities with the Highest Percentage of Dutch Population in Connecticut
| City | Dutch | vs State | vs National | |
| 1. | Bigelow Corners | 32.80% | 0.64%(+32.2)#1 | 1.01%(+31.8)#79 |
| 2. | Weston | 11.04% | 0.64%(+10.4)#2 | 1.01%(+10.0)#493 |
| 3. | North Granby | 6.75% | 0.64%(+6.11)#3 | 1.01%(+5.73)#1,066 |
| 4. | Candlewood Knolls | 6.47% | 0.64%(+5.83)#4 | 1.01%(+5.46)#1,122 |
| 5. | Lakeville | 4.85% | 0.64%(+4.22)#5 | 1.01%(+3.84)#1,767 |
| 6. | Heritage Village | 4.65% | 0.64%(+4.01)#6 | 1.01%(+3.63)#1,902 |
| 7. | Sail Harbor | 4.20% | 0.64%(+3.56)#7 | 1.01%(+3.18)#2,203 |
| 8. | Inglenook | 3.51% | 0.64%(+2.87)#8 | 1.01%(+2.50)#2,793 |
| 9. | West Simsbury | 3.00% | 0.64%(+2.37)#9 | 1.01%(+1.99)#3,452 |
| 10. | Knollcrest | 2.98% | 0.64%(+2.34)#10 | 1.01%(+1.97)#3,490 |
| 11. | New Milford | 2.92% | 0.64%(+2.28)#11 | 1.01%(+1.90)#3,568 |
| 12. | Canton Valley | 2.83% | 0.64%(+2.19)#12 | 1.01%(+1.82)#3,725 |
| 13. | Bethlehem Village | 2.81% | 0.64%(+2.17)#13 | 1.01%(+1.79)#3,764 |
| 14. | South Wilton | 2.73% | 0.64%(+2.09)#14 | 1.01%(+1.72)#3,908 |
| 15. | Woodbury Center | 2.70% | 0.64%(+2.06)#15 | 1.01%(+1.69)#3,966 |
| 16. | Riverside | 2.57% | 0.64%(+1.94)#16 | 1.01%(+1.56)#4,205 |
| 17. | Darien Downtown | 2.55% | 0.64%(+1.91)#17 | 1.01%(+1.53)#4,253 |
| 18. | Portland | 2.54% | 0.64%(+1.90)#18 | 1.01%(+1.53)#4,268 |
| 19. | Canaan | 2.51% | 0.64%(+1.88)#19 | 1.01%(+1.50)#4,329 |
| 20. | Fenwick Borough | 2.50% | 0.64%(+1.86)#20 | 1.01%(+1.49)#4,370 |
| 21. | Sandy Hook | 2.50% | 0.64%(+1.86)#21 | 1.01%(+1.49)#4,372 |
| 22. | Westbrook Center | 2.37% | 0.64%(+1.74)#22 | 1.01%(+1.36)#4,662 |
| 23. | Crystal Lake | 2.26% | 0.64%(+1.62)#23 | 1.01%(+1.25)#4,966 |
| 24. | Essex Village | 2.20% | 0.64%(+1.56)#24 | 1.01%(+1.19)#5,133 |
| 25. | Cornwall Bridge | 2.18% | 0.64%(+1.55)#25 | 1.01%(+1.17)#5,185 |
| 26. | Durham | 2.16% | 0.64%(+1.52)#26 | 1.01%(+1.15)#5,237 |
| 27. | Noroton | 2.05% | 0.64%(+1.41)#27 | 1.01%(+1.04)#5,568 |
| 28. | Noank | 1.93% | 0.64%(+1.29)#28 | 1.01%(+0.918)#5,972 |
| 29. | Falls Village | 1.90% | 0.64%(+1.27)#29 | 1.01%(+0.889)#6,076 |
| 30. | Niantic | 1.86% | 0.64%(+1.22)#30 | 1.01%(+0.845)#6,254 |
| 31. | Compo | 1.81% | 0.64%(+1.18)#31 | 1.01%(+0.800)#6,421 |
| 32. | Candlewood Shores | 1.77% | 0.64%(+1.13)#32 | 1.01%(+0.754)#6,588 |
| 33. | Bantam Borough | 1.72% | 0.64%(+1.08)#33 | 1.01%(+0.708)#6,785 |
| 34. | Greenwich | 1.70% | 0.64%(+1.06)#34 | 1.01%(+0.687)#6,880 |
| 35. | Tashua | 1.67% | 0.64%(+1.04)#35 | 1.01%(+0.661)#7,014 |
| 36. | Old Mystic | 1.60% | 0.64%(+0.958)#36 | 1.01%(+0.581)#7,347 |
| 37. | Waterford | 1.59% | 0.64%(+0.950)#37 | 1.01%(+0.573)#7,386 |
| 38. | East Brooklyn | 1.51% | 0.64%(+0.874)#38 | 1.01%(+0.498)#7,747 |
| 39. | Collinsville | 1.49% | 0.64%(+0.856)#39 | 1.01%(+0.479)#7,841 |
| 40. | Weatogue | 1.42% | 0.64%(+0.785)#40 | 1.01%(+0.409)#8,232 |
| 41. | New Preston | 1.36% | 0.64%(+0.727)#41 | 1.01%(+0.351)#8,557 |
| 42. | East Hampton | 1.36% | 0.64%(+0.721)#42 | 1.01%(+0.345)#8,596 |
| 43. | Stafford Springs | 1.33% | 0.64%(+0.692)#43 | 1.01%(+0.315)#8,770 |
| 44. | Salmon Brook | 1.28% | 0.64%(+0.645)#44 | 1.01%(+0.268)#9,084 |
| 45. | Ridgebury | 1.28% | 0.64%(+0.643)#45 | 1.01%(+0.266)#9,105 |
| 46. | Branford Center | 1.24% | 0.64%(+0.604)#46 | 1.01%(+0.228)#9,347 |
| 47. | Noroton Heights | 1.23% | 0.64%(+0.594)#47 | 1.01%(+0.217)#9,423 |
| 48. | Colchester | 1.21% | 0.64%(+0.575)#48 | 1.01%(+0.198)#9,559 |
| 49. | Old Saybrook Center | 1.14% | 0.64%(+0.503)#49 | 1.01%(+0.126)#10,030 |
| 50. | Coleytown | 1.12% | 0.64%(+0.484)#50 | 1.01%(+0.107)#10,196 |
| 51. | Moosup | 1.10% | 0.64%(+0.465)#51 | 1.01%(+0.088)#10,340 |
| 52. | Madison Center | 1.04% | 0.64%(+0.404)#52 | 1.01%(+0.028)#10,780 |
| 53. | Mystic | 1.04% | 0.64%(+0.404)#53 | 1.01%(+0.027)#10,789 |
| 54. | Coventry Lake | 1.03% | 0.64%(+0.394)#54 | 1.01%(+0.017)#10,856 |
| 55. | Terryville | 1.02% | 0.64%(+0.383)#55 | 1.01%(+0.006)#10,950 |
| 56. | Norfolk | 0.92% | 0.64%(+0.283)#56 | 1.01%(-0.094)#11,710 |
| 57. | New Canaan | 0.85% | 0.64%(+0.208)#57 | 1.01%(-0.169)#12,290 |
| 58. | Pemberwick | 0.84% | 0.64%(+0.203)#58 | 1.01%(-0.173)#12,327 |
| 59. | Old Hill | 0.84% | 0.64%(+0.203)#59 | 1.01%(-0.174)#12,330 |
| 60. | Clinton | 0.84% | 0.64%(+0.198)#60 | 1.01%(-0.179)#12,382 |
| 61. | Tokeneke | 0.82% | 0.64%(+0.178)#61 | 1.01%(-0.198)#12,557 |
| 62. | Wallingford Center | 0.81% | 0.64%(+0.174)#62 | 1.01%(-0.203)#12,597 |
| 63. | Bethel | 0.80% | 0.64%(+0.159)#63 | 1.01%(-0.217)#12,722 |
| 64. | Rockville | 0.79% | 0.64%(+0.154)#64 | 1.01%(-0.223)#12,772 |
| 65. | Ball Pond | 0.79% | 0.64%(+0.153)#65 | 1.01%(-0.224)#12,783 |
| 66. | Quinnipiac University | 0.77% | 0.64%(+0.134)#66 | 1.01%(-0.243)#12,951 |
| 67. | Oronoque | 0.76% | 0.64%(+0.125)#67 | 1.01%(-0.251)#13,026 |
| 68. | Manchester | 0.73% | 0.64%(+0.095)#68 | 1.01%(-0.282)#13,347 |
| 69. | South Windham | 0.71% | 0.64%(+0.071)#69 | 1.01%(-0.306)#13,588 |
| 70. | Bristol | 0.69% | 0.64%(+0.056)#70 | 1.01%(-0.321)#13,741 |
| 71. | Hazardville | 0.69% | 0.64%(+0.049)#71 | 1.01%(-0.328)#13,798 |
| 72. | Woodmont Borough | 0.68% | 0.64%(+0.042)#72 | 1.01%(-0.335)#13,861 |
| 73. | Conning Towers Nautilus Park | 0.67% | 0.64%(+0.035)#73 | 1.01%(-0.342)#13,931 |
| 74. | Pawcatuck | 0.66% | 0.64%(+0.027)#74 | 1.01%(-0.350)#14,008 |
| 75. | Litchfield Borough | 0.66% | 0.64%(+0.027)#75 | 1.01%(-0.350)#14,009 |
| 76. | Lakes East | 0.62% | 0.64%(-0.020)#76 | 1.01%(-0.396)#14,420 |
| 77. | Glastonbury Center | 0.62% | 0.64%(-0.022)#77 | 1.01%(-0.398)#14,436 |
| 78. | Westport | 0.60% | 0.64%(-0.038)#78 | 1.01%(-0.414)#14,576 |
| 79. | Long Hill | 0.60% | 0.64%(-0.040)#79 | 1.01%(-0.417)#14,597 |
| 80. | Cos Cob | 0.59% | 0.64%(-0.044)#80 | 1.01%(-0.420)#14,628 |
| 81. | Norwich | 0.59% | 0.64%(-0.046)#81 | 1.01%(-0.422)#14,649 |
| 82. | New London | 0.59% | 0.64%(-0.047)#82 | 1.01%(-0.423)#14,663 |
| 83. | Greens Farms | 0.59% | 0.64%(-0.047)#83 | 1.01%(-0.424)#14,666 |
| 84. | Chester Center | 0.58% | 0.64%(-0.059)#84 | 1.01%(-0.436)#14,786 |
| 85. | Ansonia | 0.58% | 0.64%(-0.062)#85 | 1.01%(-0.439)#14,815 |
| 86. | Wauregan | 0.57% | 0.64%(-0.064)#86 | 1.01%(-0.441)#14,836 |
| 87. | Stratford Downtown | 0.56% | 0.64%(-0.073)#87 | 1.01%(-0.450)#14,919 |
| 88. | North Grosvenor Dale | 0.55% | 0.64%(-0.091)#88 | 1.01%(-0.467)#15,090 |
| 89. | Oxoboxo River | 0.54% | 0.64%(-0.102)#89 | 1.01%(-0.479)#15,225 |
| 90. | Old Greenwich | 0.51% | 0.64%(-0.127)#90 | 1.01%(-0.504)#15,508 |
| 91. | New Haven | 0.51% | 0.64%(-0.130)#91 | 1.01%(-0.507)#15,539 |
| 92. | Daniels Farm | 0.49% | 0.64%(-0.143)#92 | 1.01%(-0.519)#15,656 |
| 93. | Stamford | 0.49% | 0.64%(-0.151)#93 | 1.01%(-0.527)#15,744 |
| 94. | Higganum | 0.47% | 0.64%(-0.165)#94 | 1.01%(-0.541)#15,889 |
| 95. | Milford City Balance | 0.47% | 0.64%(-0.166)#95 | 1.01%(-0.542)#15,896 |
| 96. | West Hartford | 0.47% | 0.64%(-0.168)#96 | 1.01%(-0.544)#15,915 |
| 97. | Middletown | 0.45% | 0.64%(-0.182)#97 | 1.01%(-0.559)#16,055 |
| 98. | East | 0.45% | 0.64%(-0.184)#98 | 1.01%(-0.560)#16,072 |
| 99. | Plainfield Village | 0.45% | 0.64%(-0.190)#99 | 1.01%(-0.566)#16,140 |
| 100. | Cheshire Village | 0.43% | 0.64%(-0.212)#100 | 1.01%(-0.589)#16,362 |
Common Questions
What are the Top 10 Cities with the Highest Percentage of Dutch Population in Connecticut?
Top 10 Cities with the Highest Percentage of Dutch Population in Connecticut are:
#1
6.75%
#2
4.85%
#3
4.65%
#4
3.00%
#5
2.92%
#6
2.83%
#7
2.81%
#8
2.70%
#9
2.57%
#10
2.54%
What city has the Highest Percentage of Dutch Population in Connecticut?
North Granby has the Highest Percentage of Dutch Population in Connecticut with 6.75%.
What is the Percentage of Dutch Population in the State of Connecticut?
Percentage of Dutch Population in Connecticut is 0.64%.
What is the Percentage of Dutch Population in the United States?
Percentage of Dutch Population in the United States is 1.01%.