Cities with the Lowest Inequality / Gini Index in Illinois
RELATED REPORTS & OPTIONS
Lowest Inequality / Gini Index
Illinois
Compare Cities
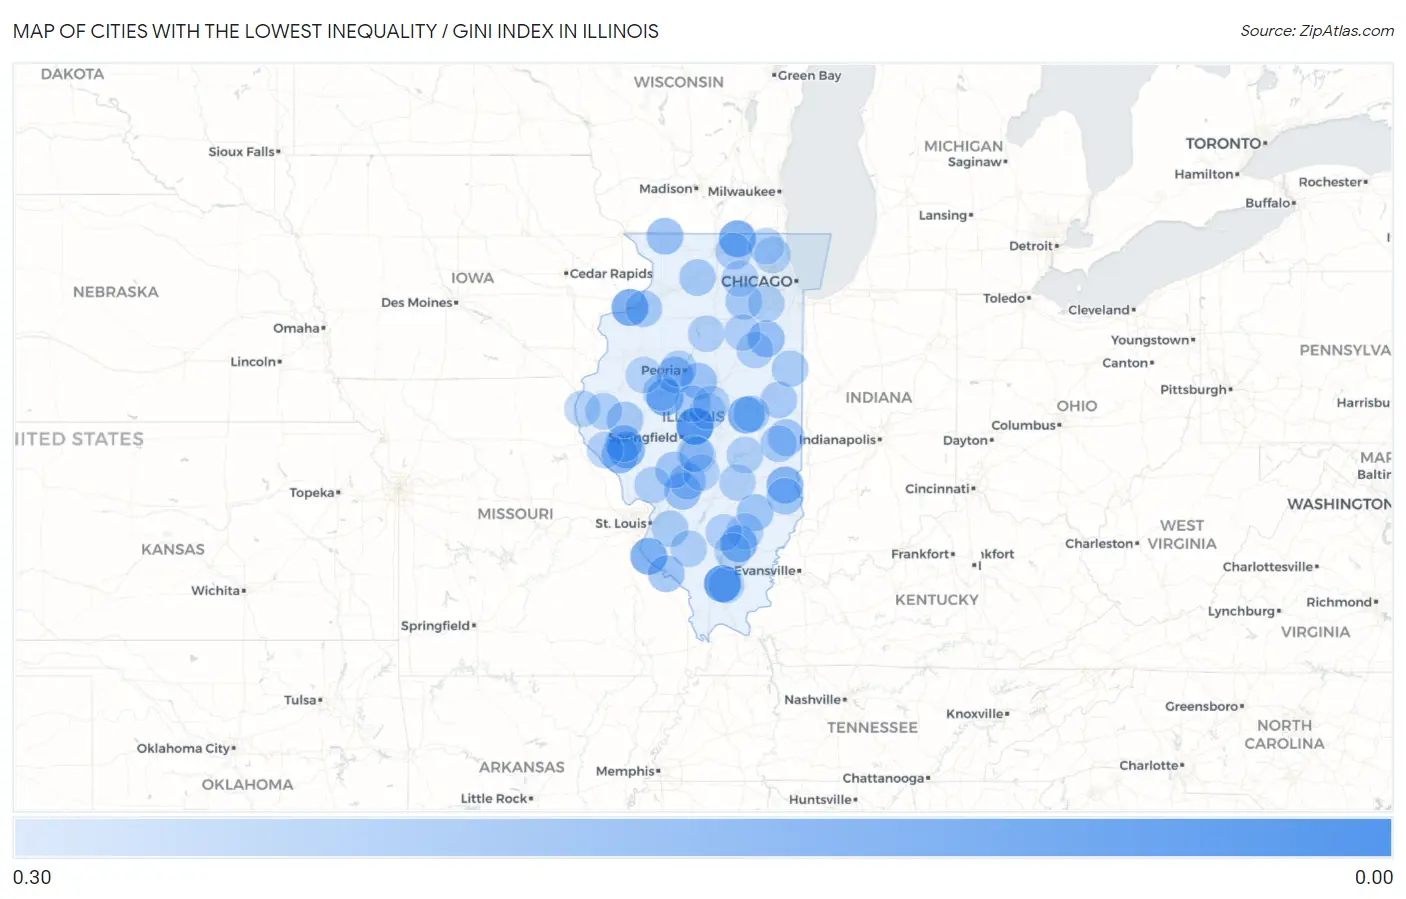
Map of Cities with the Lowest Inequality / Gini Index in Illinois
0.30
0.00
Cities with the Lowest Inequality / Gini Index in Illinois
| City | Inequality / Gini Index | vs State | vs National | |
| 1. | Lynn Center | 0.00 | 0.48(-0.480)#1 | 0.48(-0.481)#4 |
| 2. | Andres | 0.03 | 0.48(-0.450)#2 | 0.48(-0.452)#70 |
| 3. | Harding | 0.05 | 0.48(-0.432)#3 | 0.48(-0.434)#120 |
| 4. | Eagle Lake | 0.05 | 0.48(-0.427)#4 | 0.48(-0.429)#144 |
| 5. | Swedona | 0.07 | 0.48(-0.416)#5 | 0.48(-0.418)#180 |
| 6. | Joslin | 0.07 | 0.48(-0.412)#6 | 0.48(-0.414)#187 |
| 7. | Cornland | 0.07 | 0.48(-0.410)#7 | 0.48(-0.411)#200 |
| 8. | Lake | 0.09 | 0.48(-0.396)#8 | 0.48(-0.398)#248 |
| 9. | Whiteash | 0.09 | 0.48(-0.390)#9 | 0.48(-0.391)#269 |
| 10. | Ridgefield | 0.09 | 0.48(-0.387)#10 | 0.48(-0.389)#281 |
| 11. | Wedron | 0.10 | 0.48(-0.383)#11 | 0.48(-0.385)#299 |
| 12. | Marcelline | 0.10 | 0.48(-0.378)#12 | 0.48(-0.380)#322 |
| 13. | Shirley | 0.12 | 0.48(-0.366)#13 | 0.48(-0.368)#366 |
| 14. | Triumph | 0.12 | 0.48(-0.360)#14 | 0.48(-0.362)#408 |
| 15. | Prairietown | 0.13 | 0.48(-0.350)#15 | 0.48(-0.352)#453 |
| 16. | Dundas | 0.14 | 0.48(-0.343)#16 | 0.48(-0.344)#491 |
| 17. | Beverly | 0.14 | 0.48(-0.341)#17 | 0.48(-0.343)#501 |
| 18. | Rock Island Arsenal | 0.15 | 0.48(-0.335)#18 | 0.48(-0.336)#553 |
| 19. | Adams | 0.15 | 0.48(-0.333)#19 | 0.48(-0.334)#569 |
| 20. | Smithville | 0.15 | 0.48(-0.331)#20 | 0.48(-0.333)#576 |
| 21. | Nachusa | 0.15 | 0.48(-0.331)#21 | 0.48(-0.332)#588 |
| 22. | West Liberty | 0.15 | 0.48(-0.328)#22 | 0.48(-0.329)#614 |
| 23. | Chemung | 0.15 | 0.48(-0.327)#23 | 0.48(-0.328)#621 |
| 24. | Rockport | 0.16 | 0.48(-0.323)#24 | 0.48(-0.324)#658 |
| 25. | Fults | 0.16 | 0.48(-0.322)#25 | 0.48(-0.324)#667 |
| 26. | White Heath | 0.16 | 0.48(-0.320)#26 | 0.48(-0.322)#675 |
| 27. | Keenes | 0.17 | 0.48(-0.307)#27 | 0.48(-0.309)#793 |
| 28. | Topeka | 0.17 | 0.48(-0.306)#28 | 0.48(-0.308)#800 |
| 29. | Florence | 0.18 | 0.48(-0.304)#29 | 0.48(-0.305)#835 |
| 30. | Annapolis | 0.18 | 0.48(-0.299)#30 | 0.48(-0.301)#878 |
| 31. | Barstow | 0.18 | 0.48(-0.299)#31 | 0.48(-0.300)#884 |
| 32. | Nekoma | 0.19 | 0.48(-0.287)#32 | 0.48(-0.289)#1,002 |
| 33. | Preemption | 0.20 | 0.48(-0.280)#33 | 0.48(-0.282)#1,072 |
| 34. | Plum Valley | 0.20 | 0.48(-0.279)#34 | 0.48(-0.281)#1,085 |
| 35. | Time | 0.21 | 0.48(-0.276)#35 | 0.48(-0.277)#1,136 |
| 36. | Valley City | 0.21 | 0.48(-0.273)#36 | 0.48(-0.275)#1,170 |
| 37. | Marley | 0.21 | 0.48(-0.268)#37 | 0.48(-0.270)#1,251 |
| 38. | Nora | 0.22 | 0.48(-0.261)#38 | 0.48(-0.263)#1,349 |
| 39. | Bonnie Brae | 0.22 | 0.48(-0.260)#39 | 0.48(-0.261)#1,366 |
| 40. | Lake Camelot | 0.23 | 0.48(-0.256)#40 | 0.48(-0.258)#1,406 |
| 41. | Union Hill | 0.23 | 0.48(-0.255)#41 | 0.48(-0.257)#1,432 |
| 42. | Walshville | 0.23 | 0.48(-0.254)#42 | 0.48(-0.256)#1,442 |
| 43. | Illinois | 0.23 | 0.48(-0.254)#43 | 0.48(-0.256)#1,444 |
| 44. | Lane | 0.23 | 0.48(-0.253)#44 | 0.48(-0.255)#1,455 |
| 45. | Kaskaskia | 0.23 | 0.48(-0.252)#45 | 0.48(-0.253)#1,474 |
| 46. | Heritage Lake | 0.23 | 0.48(-0.249)#46 | 0.48(-0.251)#1,525 |
| 47. | Kings | 0.23 | 0.48(-0.248)#47 | 0.48(-0.249)#1,554 |
| 48. | Wilton Center | 0.24 | 0.48(-0.244)#48 | 0.48(-0.245)#1,622 |
| 49. | Burton | 0.24 | 0.48(-0.243)#49 | 0.48(-0.245)#1,634 |
| 50. | Custer Park | 0.24 | 0.48(-0.243)#50 | 0.48(-0.245)#1,636 |
| 51. | Butler | 0.24 | 0.48(-0.241)#51 | 0.48(-0.243)#1,674 |
| 52. | Standard City | 0.24 | 0.48(-0.239)#52 | 0.48(-0.241)#1,714 |
| 53. | Metcalf | 0.24 | 0.48(-0.238)#53 | 0.48(-0.239)#1,745 |
| 54. | Sailor Springs | 0.24 | 0.48(-0.237)#54 | 0.48(-0.239)#1,747 |
| 55. | Stoy | 0.25 | 0.48(-0.236)#55 | 0.48(-0.237)#1,769 |
| 56. | Lockport Heights | 0.25 | 0.48(-0.235)#56 | 0.48(-0.236)#1,795 |
| 57. | East Lynn | 0.25 | 0.48(-0.230)#57 | 0.48(-0.232)#1,894 |
| 58. | Ripley | 0.25 | 0.48(-0.229)#58 | 0.48(-0.231)#1,906 |
| 59. | Cleveland | 0.25 | 0.48(-0.228)#59 | 0.48(-0.230)#1,931 |
| 60. | Lost Nation | 0.25 | 0.48(-0.228)#60 | 0.48(-0.230)#1,939 |
| 61. | Millbrook | 0.25 | 0.48(-0.227)#61 | 0.48(-0.228)#1,971 |
| 62. | Brocton | 0.26 | 0.48(-0.226)#62 | 0.48(-0.228)#1,979 |
| 63. | Garden Prairie | 0.26 | 0.48(-0.223)#63 | 0.48(-0.224)#2,059 |
| 64. | Penfield | 0.26 | 0.48(-0.221)#64 | 0.48(-0.222)#2,109 |
| 65. | Seymour | 0.26 | 0.48(-0.219)#65 | 0.48(-0.221)#2,153 |
| 66. | Hartsburg | 0.26 | 0.48(-0.218)#66 | 0.48(-0.219)#2,183 |
| 67. | Woodland | 0.26 | 0.48(-0.217)#67 | 0.48(-0.219)#2,196 |
| 68. | Liverpool | 0.26 | 0.48(-0.217)#68 | 0.48(-0.219)#2,200 |
| 69. | Scott Afb | 0.27 | 0.48(-0.216)#69 | 0.48(-0.217)#2,235 |
| 70. | Emington | 0.27 | 0.48(-0.214)#70 | 0.48(-0.215)#2,317 |
| 71. | Millersburg | 0.27 | 0.48(-0.213)#71 | 0.48(-0.215)#2,326 |
| 72. | La Prairie | 0.27 | 0.48(-0.213)#72 | 0.48(-0.214)#2,339 |
| 73. | Oakdale | 0.27 | 0.48(-0.212)#73 | 0.48(-0.214)#2,349 |
| 74. | Allenville | 0.27 | 0.48(-0.210)#74 | 0.48(-0.212)#2,407 |
| 75. | Osco | 0.27 | 0.48(-0.210)#75 | 0.48(-0.212)#2,418 |
| 76. | Crystal Lawns | 0.27 | 0.48(-0.210)#76 | 0.48(-0.212)#2,420 |
| 77. | Fidelity | 0.27 | 0.48(-0.210)#77 | 0.48(-0.211)#2,432 |
| 78. | Langleyville | 0.27 | 0.48(-0.209)#78 | 0.48(-0.210)#2,465 |
| 79. | Norwood | 0.27 | 0.48(-0.208)#79 | 0.48(-0.210)#2,482 |
| 80. | Mcnabb | 0.27 | 0.48(-0.207)#80 | 0.48(-0.209)#2,511 |
| 81. | Shumway | 0.27 | 0.48(-0.207)#81 | 0.48(-0.208)#2,525 |
| 82. | Fowler | 0.27 | 0.48(-0.207)#82 | 0.48(-0.208)#2,526 |
| 83. | Johnsonville | 0.28 | 0.48(-0.206)#83 | 0.48(-0.208)#2,539 |
| 84. | Wenonah | 0.28 | 0.48(-0.206)#84 | 0.48(-0.207)#2,558 |
| 85. | Forest Lake | 0.28 | 0.48(-0.205)#85 | 0.48(-0.207)#2,561 |
| 86. | Kell | 0.28 | 0.48(-0.205)#86 | 0.48(-0.207)#2,588 |
| 87. | El Dara | 0.28 | 0.48(-0.204)#87 | 0.48(-0.206)#2,605 |
| 88. | Beason | 0.28 | 0.48(-0.203)#88 | 0.48(-0.205)#2,652 |
| 89. | Gulfport | 0.28 | 0.48(-0.203)#89 | 0.48(-0.205)#2,677 |
| 90. | Kinsman | 0.28 | 0.48(-0.202)#90 | 0.48(-0.204)#2,703 |
| 91. | Waynesville | 0.28 | 0.48(-0.201)#91 | 0.48(-0.203)#2,727 |
| 92. | Lima | 0.28 | 0.48(-0.200)#92 | 0.48(-0.201)#2,790 |
| 93. | Lorenzo | 0.28 | 0.48(-0.198)#93 | 0.48(-0.200)#2,845 |
| 94. | Pittsburg | 0.28 | 0.48(-0.198)#94 | 0.48(-0.200)#2,847 |
| 95. | Volo | 0.28 | 0.48(-0.198)#95 | 0.48(-0.199)#2,866 |
| 96. | Ellisville | 0.28 | 0.48(-0.198)#96 | 0.48(-0.199)#2,875 |
| 97. | Jeisyville | 0.28 | 0.48(-0.197)#97 | 0.48(-0.198)#2,909 |
| 98. | Literberry | 0.29 | 0.48(-0.195)#98 | 0.48(-0.197)#2,951 |
| 99. | Belle Rive | 0.29 | 0.48(-0.195)#99 | 0.48(-0.197)#2,964 |
| 100. | Maple Park | 0.29 | 0.48(-0.194)#100 | 0.48(-0.195)#3,009 |
Common Questions
What are the Top 10 Cities with the Lowest Inequality / Gini Index in Illinois?
Top 10 Cities with the Lowest Inequality / Gini Index in Illinois are:
#1
0.07
#2
0.09
#3
0.15
#4
0.15
#5
0.16
#6
0.16
#7
0.17
#8
0.17
#9
0.18
#10
0.18
What city has the Lowest Inequality / Gini Index in Illinois?
Cornland has the Lowest Inequality / Gini Index in Illinois with 0.07.
What is the Inequality / Gini Index in the State of Illinois?
Inequality / Gini Index in Illinois is 0.48.
What is the Inequality / Gini Index in the United States?
Inequality / Gini Index in the United States is 0.48.