Cities with the Lowest Inequality / Gini Index in Connecticut
RELATED REPORTS & OPTIONS
Lowest Inequality / Gini Index
Connecticut
Compare Cities
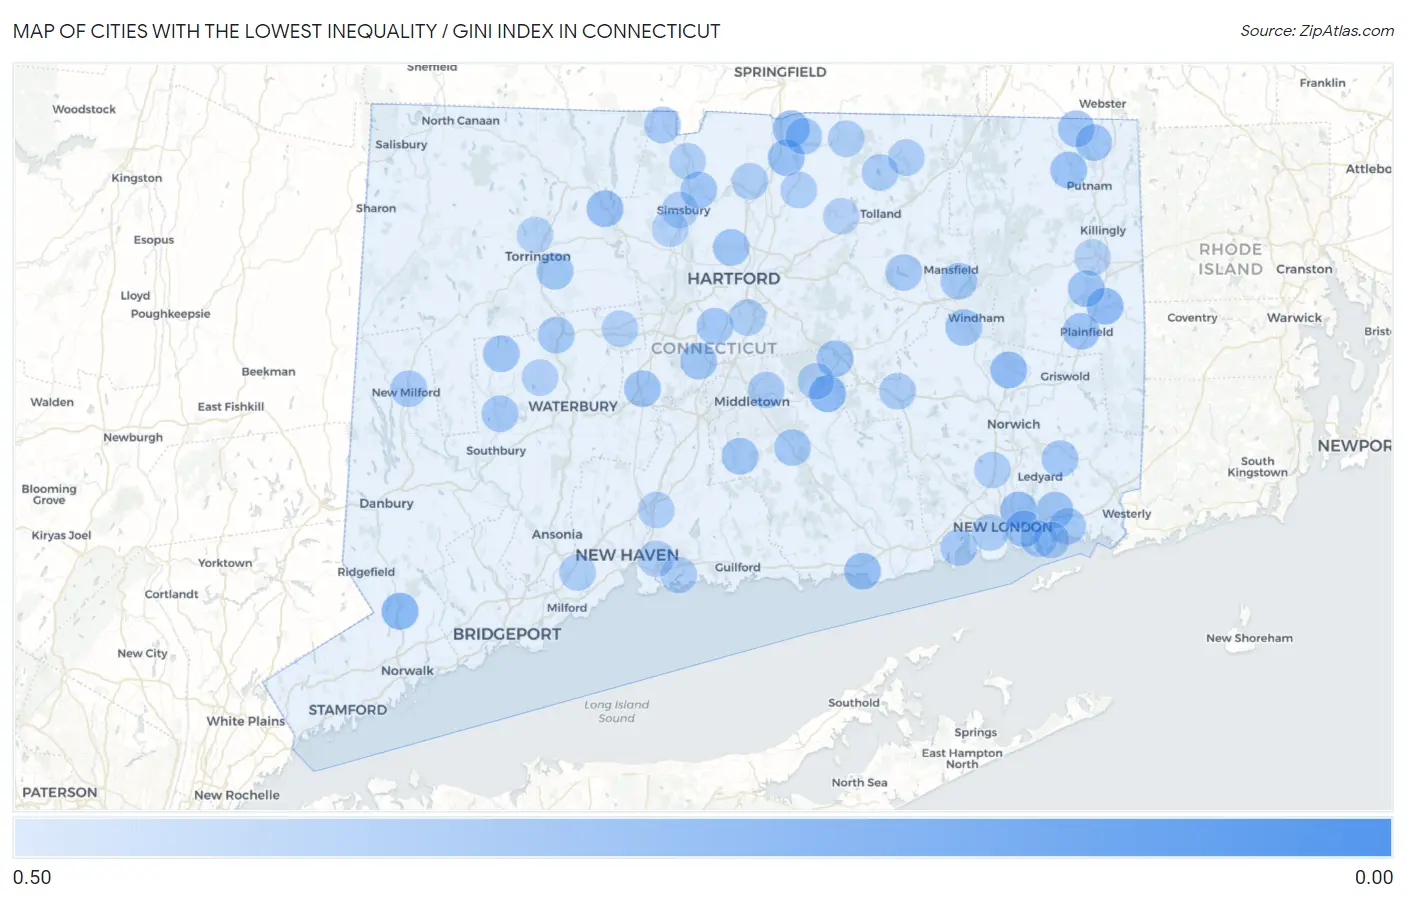
Map of Cities with the Lowest Inequality / Gini Index in Connecticut
0.50
0.00
Cities with the Lowest Inequality / Gini Index in Connecticut
| City | Inequality / Gini Index | vs State | vs National | |
| 1. | Sherman | 0.02 | 0.50(-0.476)#1 | 0.48(-0.460)#51 |
| 2. | Chimney Point | 0.13 | 0.50(-0.373)#2 | 0.48(-0.357)#432 |
| 3. | Witches Woods | 0.15 | 0.50(-0.350)#3 | 0.48(-0.334)#573 |
| 4. | Brookfield Center | 0.16 | 0.50(-0.337)#4 | 0.48(-0.321)#682 |
| 5. | Candlewood Knolls | 0.22 | 0.50(-0.278)#5 | 0.48(-0.262)#1,361 |
| 6. | Inglenook | 0.25 | 0.50(-0.246)#6 | 0.48(-0.230)#1,928 |
| 7. | Riverton | 0.26 | 0.50(-0.240)#7 | 0.48(-0.224)#2,076 |
| 8. | Lake Bungee | 0.26 | 0.50(-0.239)#8 | 0.48(-0.222)#2,100 |
| 9. | Gaylordsville | 0.26 | 0.50(-0.237)#9 | 0.48(-0.221)#2,151 |
| 10. | Lake Chaffee | 0.27 | 0.50(-0.234)#10 | 0.48(-0.218)#2,224 |
| 11. | Mechanicsville | 0.28 | 0.50(-0.215)#11 | 0.48(-0.198)#2,912 |
| 12. | Candlewood Lake Club | 0.29 | 0.50(-0.210)#12 | 0.48(-0.194)#3,083 |
| 13. | Quasset Lake | 0.29 | 0.50(-0.210)#13 | 0.48(-0.194)#3,097 |
| 14. | Cannondale | 0.29 | 0.50(-0.205)#14 | 0.48(-0.188)#3,322 |
| 15. | East Hampton | 0.31 | 0.50(-0.190)#15 | 0.48(-0.173)#4,127 |
| 16. | Route 7 Gateway | 0.31 | 0.50(-0.190)#16 | 0.48(-0.173)#4,128 |
| 17. | Lakes East | 0.31 | 0.50(-0.184)#17 | 0.48(-0.168)#4,456 |
| 18. | East | 0.32 | 0.50(-0.179)#18 | 0.48(-0.162)#4,817 |
| 19. | Moosup | 0.32 | 0.50(-0.178)#19 | 0.48(-0.162)#4,831 |
| 20. | Baltic | 0.32 | 0.50(-0.178)#20 | 0.48(-0.162)#4,871 |
| 21. | Sherwood Manor | 0.33 | 0.50(-0.170)#21 | 0.48(-0.154)#5,519 |
| 22. | Conning Towers Nautilus Park | 0.33 | 0.50(-0.170)#22 | 0.48(-0.153)#5,549 |
| 23. | Hawleyville | 0.33 | 0.50(-0.166)#23 | 0.48(-0.150)#5,870 |
| 24. | New Hartford Center | 0.33 | 0.50(-0.166)#24 | 0.48(-0.150)#5,898 |
| 25. | Jewett City Borough | 0.33 | 0.50(-0.165)#25 | 0.48(-0.149)#5,954 |
| 26. | Saybrook Manor | 0.34 | 0.50(-0.160)#26 | 0.48(-0.144)#6,464 |
| 27. | Long Hill | 0.34 | 0.50(-0.157)#27 | 0.48(-0.141)#6,741 |
| 28. | Southwood Acres | 0.34 | 0.50(-0.156)#28 | 0.48(-0.140)#6,827 |
| 29. | South Woodstock | 0.35 | 0.50(-0.152)#29 | 0.48(-0.136)#7,219 |
| 30. | Bridgewater | 0.35 | 0.50(-0.151)#30 | 0.48(-0.135)#7,412 |
| 31. | Bigelow Corners | 0.35 | 0.50(-0.150)#31 | 0.48(-0.134)#7,510 |
| 32. | Old Mystic | 0.35 | 0.50(-0.149)#32 | 0.48(-0.133)#7,631 |
| 33. | Wauregan | 0.35 | 0.50(-0.147)#33 | 0.48(-0.131)#7,869 |
| 34. | Danielson Borough | 0.35 | 0.50(-0.147)#34 | 0.48(-0.130)#7,909 |
| 35. | Terramuggus | 0.35 | 0.50(-0.145)#35 | 0.48(-0.129)#8,064 |
| 36. | Plantsville | 0.36 | 0.50(-0.144)#36 | 0.48(-0.127)#8,256 |
| 37. | Plainfield Village | 0.36 | 0.50(-0.143)#37 | 0.48(-0.127)#8,353 |
| 38. | Candlewood Shores | 0.36 | 0.50(-0.142)#38 | 0.48(-0.126)#8,470 |
| 39. | Quinebaug | 0.36 | 0.50(-0.142)#39 | 0.48(-0.125)#8,495 |
| 40. | Blue Hills | 0.36 | 0.50(-0.141)#40 | 0.48(-0.125)#8,549 |
| 41. | Tariffville | 0.36 | 0.50(-0.141)#41 | 0.48(-0.125)#8,551 |
| 42. | North Grosvenor Dale | 0.36 | 0.50(-0.140)#42 | 0.48(-0.124)#8,698 |
| 43. | Candlewood Isle | 0.36 | 0.50(-0.138)#43 | 0.48(-0.122)#8,960 |
| 44. | Durham | 0.37 | 0.50(-0.134)#44 | 0.48(-0.117)#9,556 |
| 45. | South Windham | 0.37 | 0.50(-0.132)#45 | 0.48(-0.116)#9,762 |
| 46. | Bethlehem Village | 0.37 | 0.50(-0.132)#46 | 0.48(-0.116)#9,789 |
| 47. | Kensington | 0.37 | 0.50(-0.131)#47 | 0.48(-0.115)#9,930 |
| 48. | Northwest Harwinton | 0.37 | 0.50(-0.130)#48 | 0.48(-0.114)#10,073 |
| 49. | Plattsville | 0.37 | 0.50(-0.130)#49 | 0.48(-0.113)#10,161 |
| 50. | Mansfield Center | 0.37 | 0.50(-0.129)#50 | 0.48(-0.113)#10,295 |
| 51. | Mashantucket | 0.37 | 0.50(-0.127)#51 | 0.48(-0.111)#10,552 |
| 52. | Newington | 0.37 | 0.50(-0.124)#52 | 0.48(-0.108)#10,975 |
| 53. | Higganum | 0.38 | 0.50(-0.123)#53 | 0.48(-0.107)#11,209 |
| 54. | Mystic | 0.38 | 0.50(-0.120)#54 | 0.48(-0.103)#11,757 |
| 55. | Woodbury Center | 0.38 | 0.50(-0.119)#55 | 0.48(-0.103)#11,779 |
| 56. | Hazardville | 0.38 | 0.50(-0.119)#56 | 0.48(-0.103)#11,792 |
| 57. | Mill Plain | 0.38 | 0.50(-0.119)#57 | 0.48(-0.103)#11,823 |
| 58. | Thomaston | 0.38 | 0.50(-0.116)#58 | 0.48(-0.100)#12,330 |
| 59. | Portland | 0.39 | 0.50(-0.113)#59 | 0.48(-0.097)#12,766 |
| 60. | Lake Pocotopaug | 0.39 | 0.50(-0.113)#60 | 0.48(-0.097)#12,768 |
| 61. | Topstone | 0.39 | 0.50(-0.113)#61 | 0.48(-0.097)#12,833 |
| 62. | North Granby | 0.39 | 0.50(-0.113)#62 | 0.48(-0.097)#12,870 |
| 63. | Niantic | 0.39 | 0.50(-0.113)#63 | 0.48(-0.096)#12,918 |
| 64. | New Milford | 0.39 | 0.50(-0.112)#64 | 0.48(-0.095)#13,081 |
| 65. | South Coventry | 0.39 | 0.50(-0.111)#65 | 0.48(-0.095)#13,195 |
| 66. | Branchville | 0.39 | 0.50(-0.110)#66 | 0.48(-0.094)#13,304 |
| 67. | Taylor Corners | 0.39 | 0.50(-0.110)#67 | 0.48(-0.094)#13,329 |
| 68. | Crystal Lake | 0.39 | 0.50(-0.106)#68 | 0.48(-0.090)#14,072 |
| 69. | Lakes West | 0.39 | 0.50(-0.105)#69 | 0.48(-0.089)#14,193 |
| 70. | Colchester | 0.39 | 0.50(-0.104)#70 | 0.48(-0.088)#14,315 |
| 71. | Poquonock Bridge | 0.40 | 0.50(-0.102)#71 | 0.48(-0.085)#14,779 |
| 72. | Botsford | 0.40 | 0.50(-0.101)#72 | 0.48(-0.085)#14,800 |
| 73. | Somers | 0.40 | 0.50(-0.101)#73 | 0.48(-0.085)#14,842 |
| 74. | Stafford Springs | 0.40 | 0.50(-0.100)#74 | 0.48(-0.084)#15,093 |
| 75. | Naugatuck Borough | 0.40 | 0.50(-0.099)#75 | 0.48(-0.083)#15,162 |
| 76. | Dodgingtown | 0.40 | 0.50(-0.099)#76 | 0.48(-0.083)#15,217 |
| 77. | Windsor Locks | 0.40 | 0.50(-0.099)#77 | 0.48(-0.083)#15,254 |
| 78. | Branford Center | 0.40 | 0.50(-0.098)#78 | 0.48(-0.082)#15,355 |
| 79. | Redding Center | 0.40 | 0.50(-0.098)#79 | 0.48(-0.082)#15,375 |
| 80. | Wethersfield | 0.40 | 0.50(-0.098)#80 | 0.48(-0.082)#15,426 |
| 81. | Noank | 0.40 | 0.50(-0.098)#81 | 0.48(-0.082)#15,433 |
| 82. | Waterford | 0.40 | 0.50(-0.098)#82 | 0.48(-0.081)#15,464 |
| 83. | Orange | 0.40 | 0.50(-0.097)#83 | 0.48(-0.080)#15,644 |
| 84. | Ball Pond | 0.40 | 0.50(-0.095)#84 | 0.48(-0.079)#15,928 |
| 85. | East Haven | 0.41 | 0.50(-0.094)#85 | 0.48(-0.077)#16,197 |
| 86. | Trumbull Center | 0.41 | 0.50(-0.093)#86 | 0.48(-0.077)#16,312 |
| 87. | Newtown Borough | 0.41 | 0.50(-0.093)#87 | 0.48(-0.077)#16,315 |
| 88. | Salmon Brook | 0.41 | 0.50(-0.093)#88 | 0.48(-0.076)#16,372 |
| 89. | Oxoboxo River | 0.41 | 0.50(-0.091)#89 | 0.48(-0.075)#16,666 |
| 90. | Broad Brook | 0.41 | 0.50(-0.090)#90 | 0.48(-0.074)#16,870 |
| 91. | Bristol | 0.41 | 0.50(-0.087)#91 | 0.48(-0.071)#17,372 |
| 92. | Simsbury Center | 0.42 | 0.50(-0.084)#92 | 0.48(-0.068)#17,858 |
| 93. | North Haven | 0.42 | 0.50(-0.083)#93 | 0.48(-0.067)#18,019 |
| 94. | Watertown | 0.42 | 0.50(-0.083)#94 | 0.48(-0.066)#18,074 |
| 95. | Torrington | 0.42 | 0.50(-0.080)#95 | 0.48(-0.064)#18,472 |
| 96. | Weatogue | 0.42 | 0.50(-0.076)#96 | 0.48(-0.060)#19,218 |
| 97. | Dayville | 0.42 | 0.50(-0.076)#97 | 0.48(-0.059)#19,294 |
| 98. | East Brooklyn | 0.42 | 0.50(-0.074)#98 | 0.48(-0.058)#19,487 |
| 99. | Sail Harbor | 0.43 | 0.50(-0.074)#99 | 0.48(-0.058)#19,557 |
| 100. | Rockville | 0.43 | 0.50(-0.072)#100 | 0.48(-0.055)#19,885 |
Common Questions
What are the Top 10 Cities with the Lowest Inequality / Gini Index in Connecticut?
Top 10 Cities with the Lowest Inequality / Gini Index in Connecticut are:
#1
0.29
#2
0.31
#3
0.32
#4
0.32
#5
0.33
#6
0.33
#7
0.33
#8
0.34
#9
0.34
#10
0.34
What city has the Lowest Inequality / Gini Index in Connecticut?
Cannondale has the Lowest Inequality / Gini Index in Connecticut with 0.29.
What is the Inequality / Gini Index in the State of Connecticut?
Inequality / Gini Index in Connecticut is 0.50.
What is the Inequality / Gini Index in the United States?
Inequality / Gini Index in the United States is 0.48.