Cities with the Lowest Inequality / Gini Index in Iowa
RELATED REPORTS & OPTIONS
Lowest Inequality / Gini Index
Iowa
Compare Cities
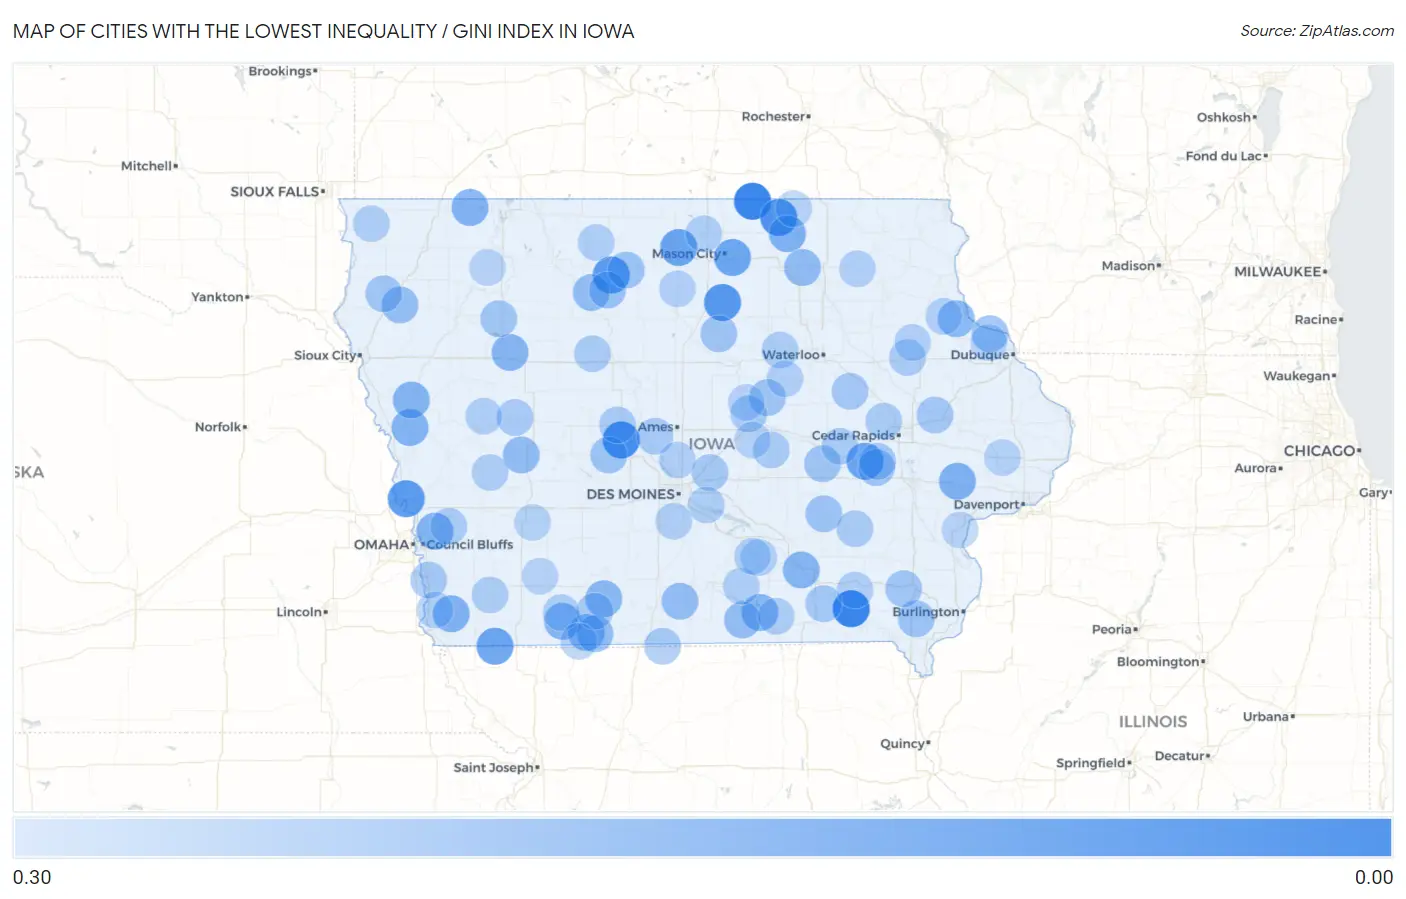
Map of Cities with the Lowest Inequality / Gini Index in Iowa
0.30
0.00
Cities with the Lowest Inequality / Gini Index in Iowa
| City | Inequality / Gini Index | vs State | vs National | |
| 1. | Leando | 0.00 | 0.44(-0.441)#1 | 0.48(-0.481)#6 |
| 2. | Mona | 0.00 | 0.44(-0.440)#2 | 0.48(-0.480)#8 |
| 3. | Kingston | 0.03 | 0.44(-0.415)#3 | 0.48(-0.455)#60 |
| 4. | Berkley | 0.03 | 0.44(-0.413)#4 | 0.48(-0.453)#66 |
| 5. | Argyle | 0.03 | 0.44(-0.412)#5 | 0.48(-0.452)#71 |
| 6. | Little Cedar | 0.05 | 0.44(-0.390)#6 | 0.48(-0.430)#141 |
| 7. | Chapin | 0.07 | 0.44(-0.370)#7 | 0.48(-0.410)#203 |
| 8. | Irvington | 0.08 | 0.44(-0.362)#8 | 0.48(-0.402)#230 |
| 9. | California Junction | 0.08 | 0.44(-0.359)#9 | 0.48(-0.399)#241 |
| 10. | Blanchard | 0.12 | 0.44(-0.328)#10 | 0.48(-0.368)#367 |
| 11. | West Amana | 0.12 | 0.44(-0.328)#11 | 0.48(-0.367)#370 |
| 12. | Miller | 0.12 | 0.44(-0.325)#12 | 0.48(-0.365)#386 |
| 13. | Portland | 0.12 | 0.44(-0.321)#13 | 0.48(-0.360)#414 |
| 14. | Rochester | 0.16 | 0.44(-0.280)#14 | 0.48(-0.320)#690 |
| 15. | New Haven | 0.17 | 0.44(-0.277)#15 | 0.48(-0.316)#728 |
| 16. | Anderson | 0.17 | 0.44(-0.272)#16 | 0.48(-0.312)#769 |
| 17. | Weston | 0.17 | 0.44(-0.270)#17 | 0.48(-0.310)#785 |
| 18. | Turin | 0.17 | 0.44(-0.268)#18 | 0.48(-0.308)#802 |
| 19. | Harris | 0.18 | 0.44(-0.268)#19 | 0.48(-0.308)#806 |
| 20. | Downey | 0.18 | 0.44(-0.267)#20 | 0.48(-0.307)#813 |
| 21. | Rodney | 0.18 | 0.44(-0.263)#21 | 0.48(-0.303)#861 |
| 22. | Nemaha | 0.18 | 0.44(-0.260)#22 | 0.48(-0.300)#888 |
| 23. | Rathbun | 0.18 | 0.44(-0.259)#23 | 0.48(-0.299)#895 |
| 24. | Chillicothe | 0.19 | 0.44(-0.257)#24 | 0.48(-0.297)#918 |
| 25. | Conway | 0.19 | 0.44(-0.257)#25 | 0.48(-0.297)#919 |
| 26. | Shannon City | 0.19 | 0.44(-0.254)#26 | 0.48(-0.294)#947 |
| 27. | Maloy | 0.19 | 0.44(-0.249)#27 | 0.48(-0.289)#1,000 |
| 28. | Osterdock | 0.20 | 0.44(-0.248)#28 | 0.48(-0.288)#1,008 |
| 29. | Bassett | 0.21 | 0.44(-0.235)#29 | 0.48(-0.275)#1,173 |
| 30. | Gray | 0.21 | 0.44(-0.234)#30 | 0.48(-0.274)#1,179 |
| 31. | Le Roy | 0.21 | 0.44(-0.231)#31 | 0.48(-0.271)#1,228 |
| 32. | Ottosen | 0.21 | 0.44(-0.230)#32 | 0.48(-0.270)#1,244 |
| 33. | Delphos | 0.21 | 0.44(-0.230)#33 | 0.48(-0.270)#1,253 |
| 34. | Plano | 0.22 | 0.44(-0.227)#34 | 0.48(-0.266)#1,289 |
| 35. | Oyens | 0.22 | 0.44(-0.226)#35 | 0.48(-0.265)#1,312 |
| 36. | Balltown | 0.22 | 0.44(-0.221)#36 | 0.48(-0.261)#1,375 |
| 37. | St Joseph | 0.23 | 0.44(-0.217)#37 | 0.48(-0.257)#1,431 |
| 38. | St Paul | 0.23 | 0.44(-0.212)#38 | 0.48(-0.252)#1,506 |
| 39. | Dawson | 0.23 | 0.44(-0.210)#39 | 0.48(-0.250)#1,529 |
| 40. | St Benedict | 0.23 | 0.44(-0.209)#40 | 0.48(-0.249)#1,563 |
| 41. | Thornburg | 0.23 | 0.44(-0.209)#41 | 0.48(-0.249)#1,567 |
| 42. | Hartwick | 0.24 | 0.44(-0.206)#42 | 0.48(-0.246)#1,607 |
| 43. | Homestead | 0.24 | 0.44(-0.206)#43 | 0.48(-0.246)#1,610 |
| 44. | Bradford | 0.24 | 0.44(-0.205)#44 | 0.48(-0.245)#1,629 |
| 45. | Beaman | 0.24 | 0.44(-0.205)#45 | 0.48(-0.244)#1,642 |
| 46. | Struble | 0.24 | 0.44(-0.203)#46 | 0.48(-0.243)#1,681 |
| 47. | Westwood | 0.24 | 0.44(-0.201)#47 | 0.48(-0.241)#1,718 |
| 48. | Truesdale | 0.25 | 0.44(-0.197)#48 | 0.48(-0.237)#1,771 |
| 49. | East Amana | 0.25 | 0.44(-0.194)#49 | 0.48(-0.234)#1,844 |
| 50. | Stone City | 0.25 | 0.44(-0.193)#50 | 0.48(-0.233)#1,862 |
| 51. | Floris | 0.25 | 0.44(-0.192)#51 | 0.48(-0.232)#1,891 |
| 52. | Mount Auburn | 0.25 | 0.44(-0.192)#52 | 0.48(-0.231)#1,898 |
| 53. | Pacific Junction | 0.25 | 0.44(-0.190)#53 | 0.48(-0.229)#1,946 |
| 54. | Valeria | 0.26 | 0.44(-0.186)#54 | 0.48(-0.226)#2,023 |
| 55. | Pleasanton | 0.26 | 0.44(-0.185)#55 | 0.48(-0.225)#2,039 |
| 56. | Diagonal | 0.26 | 0.44(-0.184)#56 | 0.48(-0.224)#2,061 |
| 57. | Luther | 0.26 | 0.44(-0.184)#57 | 0.48(-0.224)#2,067 |
| 58. | Albion | 0.26 | 0.44(-0.183)#58 | 0.48(-0.223)#2,086 |
| 59. | Beaver | 0.26 | 0.44(-0.183)#59 | 0.48(-0.223)#2,098 |
| 60. | Arcadia | 0.26 | 0.44(-0.181)#60 | 0.48(-0.221)#2,137 |
| 61. | Bentley | 0.26 | 0.44(-0.179)#61 | 0.48(-0.219)#2,206 |
| 62. | Palo | 0.26 | 0.44(-0.178)#62 | 0.48(-0.218)#2,212 |
| 63. | Gilman | 0.27 | 0.44(-0.178)#63 | 0.48(-0.218)#2,228 |
| 64. | Luzerne | 0.27 | 0.44(-0.178)#64 | 0.48(-0.218)#2,232 |
| 65. | Harper | 0.27 | 0.44(-0.177)#65 | 0.48(-0.217)#2,250 |
| 66. | Barnum | 0.27 | 0.44(-0.177)#66 | 0.48(-0.217)#2,262 |
| 67. | Masonville | 0.27 | 0.44(-0.177)#67 | 0.48(-0.216)#2,276 |
| 68. | Coburg | 0.27 | 0.44(-0.174)#68 | 0.48(-0.214)#2,340 |
| 69. | Kirkman | 0.27 | 0.44(-0.173)#69 | 0.48(-0.213)#2,386 |
| 70. | Udell | 0.27 | 0.44(-0.172)#70 | 0.48(-0.212)#2,422 |
| 71. | Sharpsburg | 0.27 | 0.44(-0.171)#71 | 0.48(-0.211)#2,433 |
| 72. | Stout | 0.27 | 0.44(-0.171)#72 | 0.48(-0.211)#2,455 |
| 73. | Runnells | 0.27 | 0.44(-0.170)#73 | 0.48(-0.210)#2,463 |
| 74. | Thurman | 0.27 | 0.44(-0.170)#74 | 0.48(-0.210)#2,484 |
| 75. | Hanlontown | 0.27 | 0.44(-0.169)#75 | 0.48(-0.209)#2,497 |
| 76. | Hamilton | 0.27 | 0.44(-0.169)#76 | 0.48(-0.209)#2,500 |
| 77. | Spring Hill | 0.27 | 0.44(-0.169)#77 | 0.48(-0.209)#2,505 |
| 78. | Alvord | 0.27 | 0.44(-0.169)#78 | 0.48(-0.209)#2,518 |
| 79. | Deloit | 0.28 | 0.44(-0.168)#79 | 0.48(-0.207)#2,554 |
| 80. | Lone Rock | 0.28 | 0.44(-0.167)#80 | 0.48(-0.207)#2,566 |
| 81. | Melrose | 0.28 | 0.44(-0.166)#81 | 0.48(-0.206)#2,597 |
| 82. | Marysville | 0.28 | 0.44(-0.166)#82 | 0.48(-0.206)#2,601 |
| 83. | Libertyville | 0.28 | 0.44(-0.166)#83 | 0.48(-0.205)#2,634 |
| 84. | Morrison | 0.28 | 0.44(-0.165)#84 | 0.48(-0.205)#2,664 |
| 85. | Alleman | 0.28 | 0.44(-0.165)#85 | 0.48(-0.205)#2,679 |
| 86. | Goodell | 0.28 | 0.44(-0.164)#86 | 0.48(-0.204)#2,695 |
| 87. | Elkport | 0.28 | 0.44(-0.163)#87 | 0.48(-0.203)#2,745 |
| 88. | Waucoma | 0.28 | 0.44(-0.163)#88 | 0.48(-0.202)#2,753 |
| 89. | Dundee | 0.28 | 0.44(-0.162)#89 | 0.48(-0.202)#2,760 |
| 90. | Blockton | 0.28 | 0.44(-0.160)#90 | 0.48(-0.200)#2,833 |
| 91. | Calamus | 0.28 | 0.44(-0.159)#91 | 0.48(-0.199)#2,892 |
| 92. | Rickardsville | 0.28 | 0.44(-0.159)#92 | 0.48(-0.199)#2,893 |
| 93. | Wiota | 0.29 | 0.44(-0.156)#93 | 0.48(-0.196)#2,979 |
| 94. | Carbon | 0.29 | 0.44(-0.155)#94 | 0.48(-0.195)#3,018 |
| 95. | Liscomb | 0.29 | 0.44(-0.155)#95 | 0.48(-0.195)#3,036 |
| 96. | Royal | 0.29 | 0.44(-0.155)#96 | 0.48(-0.195)#3,041 |
| 97. | Haverhill | 0.29 | 0.44(-0.155)#97 | 0.48(-0.194)#3,067 |
| 98. | Montpelier | 0.29 | 0.44(-0.154)#98 | 0.48(-0.194)#3,076 |
| 99. | Mcintire | 0.29 | 0.44(-0.154)#99 | 0.48(-0.194)#3,078 |
| 100. | Fruitland | 0.29 | 0.44(-0.154)#100 | 0.48(-0.194)#3,089 |
Common Questions
What are the Top 10 Cities with the Lowest Inequality / Gini Index in Iowa?
Top 10 Cities with the Lowest Inequality / Gini Index in Iowa are:
#1
0.00
#2
0.00
#3
0.03
#4
0.05
#5
0.07
#6
0.08
#7
0.08
#8
0.12
#9
0.12
#10
0.12
What city has the Lowest Inequality / Gini Index in Iowa?
Leando has the Lowest Inequality / Gini Index in Iowa with 0.00.
What is the Inequality / Gini Index in the State of Iowa?
Inequality / Gini Index in Iowa is 0.44.
What is the Inequality / Gini Index in the United States?
Inequality / Gini Index in the United States is 0.48.