Cities with the Lowest Inequality / Gini Index in Vermont
RELATED REPORTS & OPTIONS
Lowest Inequality / Gini Index
Vermont
Compare Cities
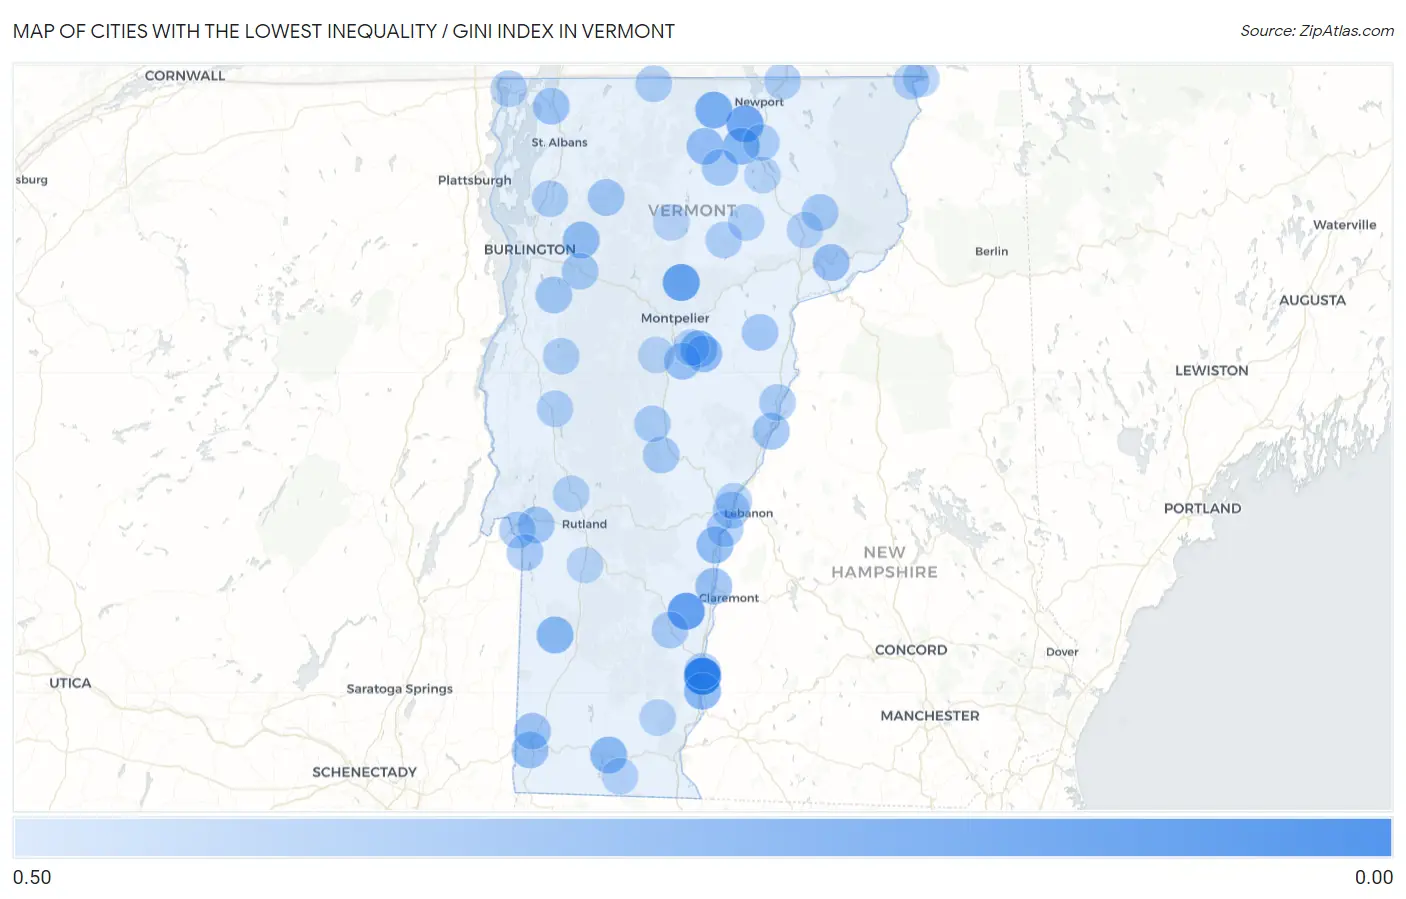
Map of Cities with the Lowest Inequality / Gini Index in Vermont
0.50
0.00
Cities with the Lowest Inequality / Gini Index in Vermont
| City | Inequality / Gini Index | vs State | vs National | |
| 1. | North Westminster | 0.03 | 0.45(-0.418)#1 | 0.48(-0.452)#69 |
| 2. | Underhill Center | 0.06 | 0.45(-0.391)#2 | 0.48(-0.426)#154 |
| 3. | Hanksville | 0.11 | 0.45(-0.340)#3 | 0.48(-0.375)#340 |
| 4. | Wardsboro | 0.14 | 0.45(-0.310)#4 | 0.48(-0.344)#495 |
| 5. | Pownal | 0.16 | 0.45(-0.290)#5 | 0.48(-0.324)#661 |
| 6. | North Springfield | 0.16 | 0.45(-0.289)#6 | 0.48(-0.323)#671 |
| 7. | Chimney Hill | 0.16 | 0.45(-0.286)#7 | 0.48(-0.321)#685 |
| 8. | East Charlotte | 0.17 | 0.45(-0.278)#8 | 0.48(-0.313)#755 |
| 9. | Worcester | 0.17 | 0.45(-0.276)#9 | 0.48(-0.310)#782 |
| 10. | Lyndon | 0.17 | 0.45(-0.275)#10 | 0.48(-0.309)#792 |
| 11. | Coventry | 0.20 | 0.45(-0.247)#11 | 0.48(-0.282)#1,078 |
| 12. | North Pownal | 0.21 | 0.45(-0.237)#12 | 0.48(-0.272)#1,219 |
| 13. | Huntington Center | 0.22 | 0.45(-0.231)#13 | 0.48(-0.265)#1,318 |
| 14. | Sutton | 0.23 | 0.45(-0.221)#14 | 0.48(-0.255)#1,448 |
| 15. | Troy | 0.23 | 0.45(-0.216)#15 | 0.48(-0.250)#1,543 |
| 16. | Highgate Center | 0.24 | 0.45(-0.208)#16 | 0.48(-0.242)#1,690 |
| 17. | North Hyde Park | 0.25 | 0.45(-0.195)#17 | 0.48(-0.229)#1,955 |
| 18. | West Charlotte | 0.26 | 0.45(-0.184)#18 | 0.48(-0.219)#2,205 |
| 19. | West Dummerston | 0.27 | 0.45(-0.178)#19 | 0.48(-0.212)#2,404 |
| 20. | Websterville | 0.27 | 0.45(-0.177)#20 | 0.48(-0.212)#2,411 |
| 21. | Bolton Valley | 0.27 | 0.45(-0.176)#21 | 0.48(-0.211)#2,447 |
| 22. | Westminster | 0.27 | 0.45(-0.174)#22 | 0.48(-0.209)#2,508 |
| 23. | Dorset | 0.27 | 0.45(-0.174)#23 | 0.48(-0.209)#2,516 |
| 24. | Irasburg | 0.28 | 0.45(-0.172)#24 | 0.48(-0.207)#2,578 |
| 25. | Pownal Center | 0.28 | 0.45(-0.171)#25 | 0.48(-0.205)#2,648 |
| 26. | Underhill Flats | 0.28 | 0.45(-0.169)#26 | 0.48(-0.204)#2,717 |
| 27. | Westford | 0.28 | 0.45(-0.169)#27 | 0.48(-0.203)#2,725 |
| 28. | Lyndon Center | 0.28 | 0.45(-0.167)#28 | 0.48(-0.201)#2,802 |
| 29. | Wilmington | 0.28 | 0.45(-0.167)#29 | 0.48(-0.201)#2,808 |
| 30. | South Hero | 0.29 | 0.45(-0.156)#30 | 0.48(-0.191)#3,218 |
| 31. | Middletown Springs | 0.29 | 0.45(-0.154)#31 | 0.48(-0.188)#3,340 |
| 32. | Jericho | 0.30 | 0.45(-0.151)#32 | 0.48(-0.185)#3,470 |
| 33. | Hartland | 0.30 | 0.45(-0.150)#33 | 0.48(-0.184)#3,520 |
| 34. | Londonderry | 0.30 | 0.45(-0.149)#34 | 0.48(-0.183)#3,590 |
| 35. | Bolton | 0.30 | 0.45(-0.148)#35 | 0.48(-0.182)#3,649 |
| 36. | Chittenden | 0.30 | 0.45(-0.146)#36 | 0.48(-0.180)#3,703 |
| 37. | East Barre | 0.30 | 0.45(-0.146)#37 | 0.48(-0.180)#3,709 |
| 38. | Lowell | 0.30 | 0.45(-0.145)#38 | 0.48(-0.179)#3,797 |
| 39. | Harmonyville | 0.31 | 0.45(-0.143)#39 | 0.48(-0.177)#3,881 |
| 40. | New Haven | 0.31 | 0.45(-0.138)#40 | 0.48(-0.172)#4,207 |
| 41. | Whitingham | 0.31 | 0.45(-0.137)#41 | 0.48(-0.171)#4,276 |
| 42. | South Lincoln | 0.31 | 0.45(-0.135)#42 | 0.48(-0.169)#4,405 |
| 43. | Concord | 0.32 | 0.45(-0.130)#43 | 0.48(-0.164)#4,698 |
| 44. | Lunenburg | 0.32 | 0.45(-0.130)#44 | 0.48(-0.164)#4,720 |
| 45. | Ascutney | 0.32 | 0.45(-0.129)#45 | 0.48(-0.163)#4,791 |
| 46. | Williamstown | 0.32 | 0.45(-0.127)#46 | 0.48(-0.161)#4,886 |
| 47. | Old Bennington | 0.32 | 0.45(-0.126)#47 | 0.48(-0.161)#4,957 |
| 48. | Bakersfield | 0.33 | 0.45(-0.121)#48 | 0.48(-0.155)#5,408 |
| 49. | Stratton Mountain | 0.33 | 0.45(-0.120)#49 | 0.48(-0.154)#5,477 |
| 50. | Swanton | 0.33 | 0.45(-0.115)#50 | 0.48(-0.150)#5,897 |
| 51. | Fairlee | 0.33 | 0.45(-0.114)#51 | 0.48(-0.148)#6,029 |
| 52. | South Shaftsbury | 0.34 | 0.45(-0.113)#52 | 0.48(-0.147)#6,132 |
| 53. | Sheffield | 0.34 | 0.45(-0.110)#53 | 0.48(-0.145)#6,369 |
| 54. | Cambridge | 0.34 | 0.45(-0.109)#54 | 0.48(-0.143)#6,487 |
| 55. | Wolcott | 0.34 | 0.45(-0.104)#55 | 0.48(-0.138)#6,991 |
| 56. | Lincoln | 0.35 | 0.45(-0.102)#56 | 0.48(-0.136)#7,192 |
| 57. | Hinesburg | 0.35 | 0.45(-0.101)#57 | 0.48(-0.135)#7,354 |
| 58. | Castleton | 0.35 | 0.45(-0.097)#58 | 0.48(-0.131)#7,795 |
| 59. | Grafton | 0.35 | 0.45(-0.097)#59 | 0.48(-0.131)#7,802 |
| 60. | Groton | 0.35 | 0.45(-0.095)#60 | 0.48(-0.130)#7,972 |
| 61. | Albany | 0.35 | 0.45(-0.095)#61 | 0.48(-0.130)#7,973 |
| 62. | St. George | 0.36 | 0.45(-0.093)#62 | 0.48(-0.127)#8,284 |
| 63. | Bethel | 0.36 | 0.45(-0.090)#63 | 0.48(-0.124)#8,629 |
| 64. | Fair Haven | 0.36 | 0.45(-0.090)#64 | 0.48(-0.124)#8,652 |
| 65. | White River Junction | 0.36 | 0.45(-0.087)#65 | 0.48(-0.121)#9,029 |
| 66. | Jamaica | 0.36 | 0.45(-0.087)#66 | 0.48(-0.121)#9,105 |
| 67. | East Burke | 0.36 | 0.45(-0.086)#67 | 0.48(-0.120)#9,156 |
| 68. | Richmond | 0.36 | 0.45(-0.086)#68 | 0.48(-0.120)#9,238 |
| 69. | North Hartland | 0.36 | 0.45(-0.084)#69 | 0.48(-0.118)#9,464 |
| 70. | Poultney | 0.37 | 0.45(-0.083)#70 | 0.48(-0.117)#9,652 |
| 71. | Chester | 0.37 | 0.45(-0.082)#71 | 0.48(-0.116)#9,726 |
| 72. | Proctor | 0.37 | 0.45(-0.078)#72 | 0.48(-0.113)#10,294 |
| 73. | Randolph | 0.37 | 0.45(-0.077)#73 | 0.48(-0.112)#10,436 |
| 74. | Richford | 0.37 | 0.45(-0.076)#74 | 0.48(-0.110)#10,691 |
| 75. | Orleans | 0.37 | 0.45(-0.075)#75 | 0.48(-0.109)#10,790 |
| 76. | Bradford | 0.37 | 0.45(-0.074)#76 | 0.48(-0.108)#10,991 |
| 77. | Bellows Falls | 0.38 | 0.45(-0.073)#77 | 0.48(-0.107)#11,156 |
| 78. | Milton | 0.38 | 0.45(-0.072)#78 | 0.48(-0.107)#11,206 |
| 79. | Alburgh | 0.38 | 0.45(-0.068)#79 | 0.48(-0.103)#11,880 |
| 80. | East Middlebury | 0.38 | 0.45(-0.068)#80 | 0.48(-0.102)#11,936 |
| 81. | Hardwick | 0.38 | 0.45(-0.068)#81 | 0.48(-0.102)#11,946 |
| 82. | Derby Line | 0.38 | 0.45(-0.066)#82 | 0.48(-0.100)#12,257 |
| 83. | Bristol | 0.38 | 0.45(-0.066)#83 | 0.48(-0.100)#12,268 |
| 84. | Pittsford | 0.38 | 0.45(-0.065)#84 | 0.48(-0.100)#12,402 |
| 85. | Beecher Falls | 0.38 | 0.45(-0.065)#85 | 0.48(-0.099)#12,495 |
| 86. | Danby | 0.38 | 0.45(-0.064)#86 | 0.48(-0.098)#12,637 |
| 87. | Greensboro Bend | 0.38 | 0.45(-0.064)#87 | 0.48(-0.098)#12,648 |
| 88. | Wilder | 0.39 | 0.45(-0.061)#88 | 0.48(-0.095)#13,052 |
| 89. | Gilman | 0.39 | 0.45(-0.060)#89 | 0.48(-0.094)#13,315 |
| 90. | East Poultney | 0.39 | 0.45(-0.059)#90 | 0.48(-0.093)#13,498 |
| 91. | South Barre | 0.39 | 0.45(-0.058)#91 | 0.48(-0.092)#13,600 |
| 92. | Jacksonville | 0.39 | 0.45(-0.057)#92 | 0.48(-0.091)#13,827 |
| 93. | Lyndonville | 0.39 | 0.45(-0.054)#93 | 0.48(-0.089)#14,249 |
| 94. | Canaan | 0.40 | 0.45(-0.053)#94 | 0.48(-0.088)#14,400 |
| 95. | Newfane | 0.40 | 0.45(-0.053)#95 | 0.48(-0.087)#14,460 |
| 96. | Weston | 0.40 | 0.45(-0.051)#96 | 0.48(-0.086)#14,684 |
| 97. | Glover | 0.40 | 0.45(-0.051)#97 | 0.48(-0.086)#14,747 |
| 98. | Northfield | 0.40 | 0.45(-0.046)#98 | 0.48(-0.081)#15,612 |
| 99. | Wallingford | 0.40 | 0.45(-0.044)#99 | 0.48(-0.079)#15,954 |
| 100. | Morrisville | 0.40 | 0.45(-0.044)#100 | 0.48(-0.078)#16,072 |
1
2Common Questions
What are the Top 10 Cities with the Lowest Inequality / Gini Index in Vermont?
Top 10 Cities with the Lowest Inequality / Gini Index in Vermont are:
#1
0.03
#2
0.16
#3
0.17
#4
0.20
#5
0.23
#6
0.27
#7
0.27
#8
0.27
#9
0.28
#10
0.28
What city has the Lowest Inequality / Gini Index in Vermont?
North Westminster has the Lowest Inequality / Gini Index in Vermont with 0.03.
What is the Inequality / Gini Index in the State of Vermont?
Inequality / Gini Index in Vermont is 0.45.
What is the Inequality / Gini Index in the United States?
Inequality / Gini Index in the United States is 0.48.