Cities with the Lowest Inequality / Gini Index in Minnesota
RELATED REPORTS & OPTIONS
Lowest Inequality / Gini Index
Minnesota
Compare Cities
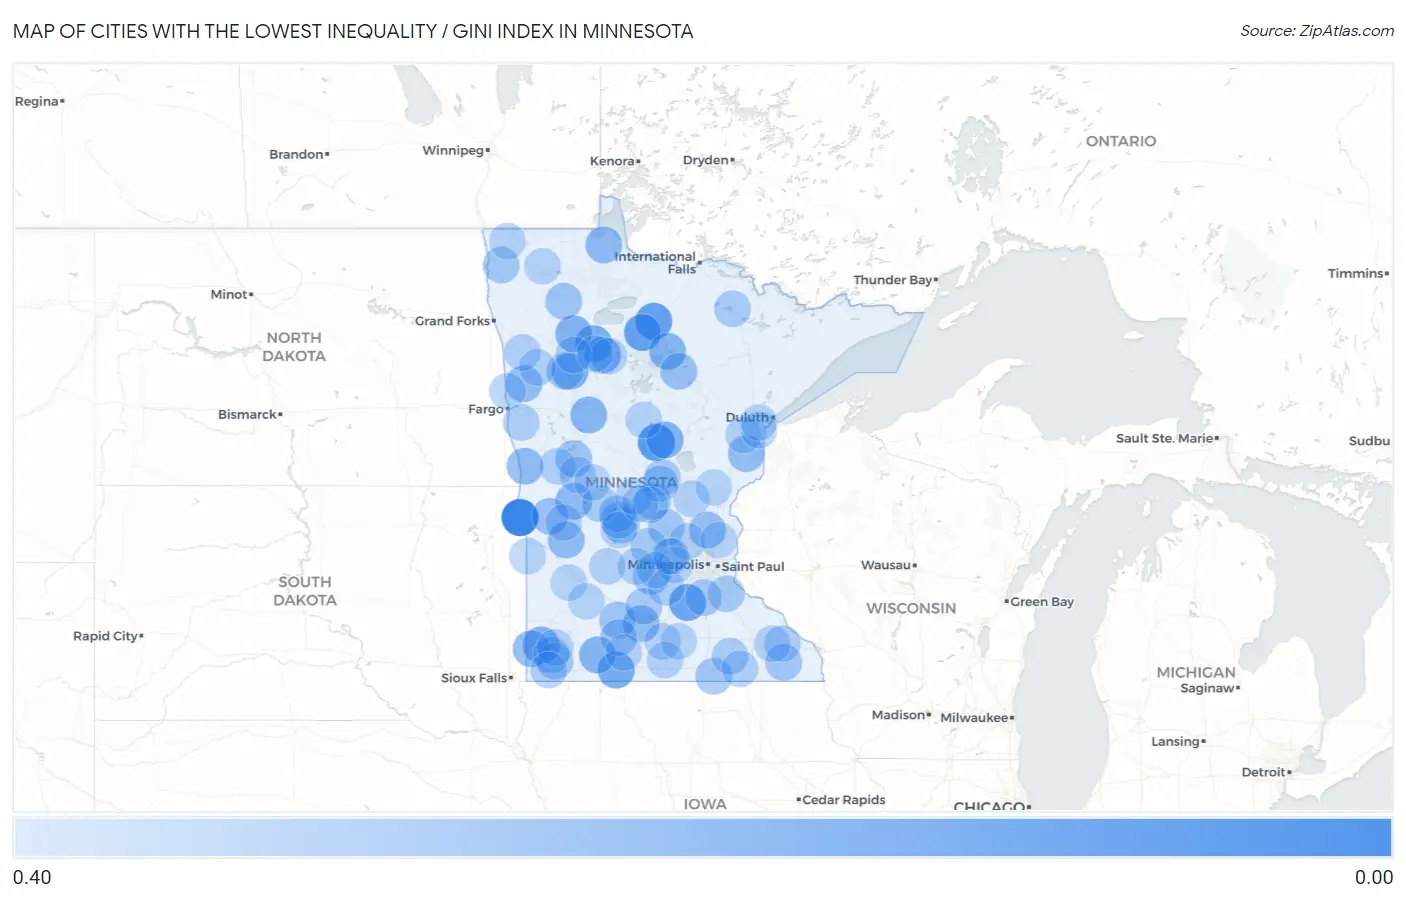
Map of Cities with the Lowest Inequality / Gini Index in Minnesota
0.40
0.00
Cities with the Lowest Inequality / Gini Index in Minnesota
| City | Inequality / Gini Index | vs State | vs National | |
| 1. | Barry | 0.04 | 0.45(-0.406)#1 | 0.48(-0.439)#101 |
| 2. | Crown College | 0.08 | 0.45(-0.374)#2 | 0.48(-0.407)#213 |
| 3. | Merrifield | 0.12 | 0.45(-0.331)#3 | 0.48(-0.364)#391 |
| 4. | Mizpah | 0.14 | 0.45(-0.309)#4 | 0.48(-0.343)#505 |
| 5. | Funkley | 0.14 | 0.45(-0.305)#5 | 0.48(-0.339)#535 |
| 6. | Heidelberg | 0.16 | 0.45(-0.292)#6 | 0.48(-0.326)#644 |
| 7. | St. John's University | 0.17 | 0.45(-0.277)#7 | 0.48(-0.310)#781 |
| 8. | Alpha | 0.18 | 0.45(-0.274)#8 | 0.48(-0.307)#810 |
| 9. | Leonard | 0.18 | 0.45(-0.267)#9 | 0.48(-0.300)#885 |
| 10. | The Ranch | 0.19 | 0.45(-0.255)#10 | 0.48(-0.288)#1,005 |
| 11. | Hatfield | 0.20 | 0.45(-0.251)#11 | 0.48(-0.284)#1,046 |
| 12. | Gully | 0.20 | 0.45(-0.250)#12 | 0.48(-0.284)#1,051 |
| 13. | Trommald | 0.20 | 0.45(-0.249)#13 | 0.48(-0.283)#1,065 |
| 14. | Solway | 0.20 | 0.45(-0.248)#14 | 0.48(-0.282)#1,076 |
| 15. | Inger | 0.20 | 0.45(-0.245)#15 | 0.48(-0.278)#1,119 |
| 16. | Wilder | 0.21 | 0.45(-0.243)#16 | 0.48(-0.276)#1,155 |
| 17. | Wolf Lake | 0.21 | 0.45(-0.239)#17 | 0.48(-0.272)#1,214 |
| 18. | Farwell | 0.22 | 0.45(-0.227)#18 | 0.48(-0.261)#1,372 |
| 19. | Roosevelt | 0.22 | 0.45(-0.227)#19 | 0.48(-0.260)#1,379 |
| 20. | Ihlen | 0.22 | 0.45(-0.226)#20 | 0.48(-0.259)#1,391 |
| 21. | Doran | 0.23 | 0.45(-0.221)#21 | 0.48(-0.254)#1,462 |
| 22. | Danvers | 0.23 | 0.45(-0.220)#22 | 0.48(-0.254)#1,467 |
| 23. | Searles | 0.23 | 0.45(-0.219)#23 | 0.48(-0.252)#1,496 |
| 24. | Borup | 0.24 | 0.45(-0.213)#24 | 0.48(-0.247)#1,596 |
| 25. | Kerrick | 0.24 | 0.45(-0.210)#25 | 0.48(-0.243)#1,671 |
| 26. | Essig | 0.24 | 0.45(-0.208)#26 | 0.48(-0.241)#1,701 |
| 27. | Bethel | 0.24 | 0.45(-0.208)#27 | 0.48(-0.241)#1,706 |
| 28. | Alberta | 0.25 | 0.45(-0.204)#28 | 0.48(-0.237)#1,766 |
| 29. | Zemple | 0.25 | 0.45(-0.199)#29 | 0.48(-0.232)#1,884 |
| 30. | Lake Henry | 0.25 | 0.45(-0.198)#30 | 0.48(-0.231)#1,911 |
| 31. | Biscay | 0.25 | 0.45(-0.195)#31 | 0.48(-0.229)#1,966 |
| 32. | Goodridge | 0.26 | 0.45(-0.193)#32 | 0.48(-0.226)#2,015 |
| 33. | Spring Hill | 0.26 | 0.45(-0.192)#33 | 0.48(-0.225)#2,043 |
| 34. | Cobden | 0.26 | 0.45(-0.191)#34 | 0.48(-0.224)#2,057 |
| 35. | Clitherall | 0.26 | 0.45(-0.191)#35 | 0.48(-0.224)#2,060 |
| 36. | Whalan | 0.26 | 0.45(-0.188)#36 | 0.48(-0.221)#2,139 |
| 37. | Darfur | 0.26 | 0.45(-0.187)#37 | 0.48(-0.220)#2,163 |
| 38. | Midway | 0.26 | 0.45(-0.185)#38 | 0.48(-0.218)#2,223 |
| 39. | Rice | 0.27 | 0.45(-0.184)#39 | 0.48(-0.217)#2,255 |
| 40. | Myrtle | 0.27 | 0.45(-0.182)#40 | 0.48(-0.216)#2,297 |
| 41. | Clear Lake | 0.27 | 0.45(-0.182)#41 | 0.48(-0.215)#2,322 |
| 42. | Lismore | 0.27 | 0.45(-0.181)#42 | 0.48(-0.214)#2,335 |
| 43. | Donaldson | 0.27 | 0.45(-0.181)#43 | 0.48(-0.214)#2,338 |
| 44. | Kingston | 0.27 | 0.45(-0.179)#44 | 0.48(-0.212)#2,395 |
| 45. | Lastrup | 0.27 | 0.45(-0.179)#45 | 0.48(-0.212)#2,409 |
| 46. | Greenwald | 0.27 | 0.45(-0.175)#46 | 0.48(-0.209)#2,509 |
| 47. | New Trier | 0.27 | 0.45(-0.175)#47 | 0.48(-0.208)#2,527 |
| 48. | Elko New Market | 0.28 | 0.45(-0.173)#48 | 0.48(-0.206)#2,603 |
| 49. | Lafayette | 0.28 | 0.45(-0.173)#49 | 0.48(-0.206)#2,609 |
| 50. | Genola | 0.28 | 0.45(-0.169)#50 | 0.48(-0.203)#2,738 |
| 51. | Westport | 0.28 | 0.45(-0.169)#51 | 0.48(-0.203)#2,742 |
| 52. | Orr | 0.28 | 0.45(-0.168)#52 | 0.48(-0.202)#2,783 |
| 53. | Knife River | 0.28 | 0.45(-0.167)#53 | 0.48(-0.201)#2,817 |
| 54. | Waltham | 0.29 | 0.45(-0.164)#54 | 0.48(-0.197)#2,941 |
| 55. | Lengby | 0.29 | 0.45(-0.163)#55 | 0.48(-0.196)#2,974 |
| 56. | High Forest | 0.29 | 0.45(-0.162)#56 | 0.48(-0.195)#3,015 |
| 57. | Gary | 0.29 | 0.45(-0.161)#57 | 0.48(-0.194)#3,082 |
| 58. | Mahtowa | 0.29 | 0.45(-0.160)#58 | 0.48(-0.193)#3,110 |
| 59. | Leota | 0.29 | 0.45(-0.159)#59 | 0.48(-0.192)#3,155 |
| 60. | Wrenshall | 0.29 | 0.45(-0.157)#60 | 0.48(-0.191)#3,226 |
| 61. | Georgetown | 0.29 | 0.45(-0.157)#61 | 0.48(-0.191)#3,229 |
| 62. | Chandler | 0.29 | 0.45(-0.157)#62 | 0.48(-0.190)#3,238 |
| 63. | Waverly | 0.29 | 0.45(-0.156)#63 | 0.48(-0.189)#3,289 |
| 64. | Utica | 0.29 | 0.45(-0.156)#64 | 0.48(-0.189)#3,295 |
| 65. | Baker | 0.29 | 0.45(-0.156)#65 | 0.48(-0.189)#3,300 |
| 66. | Elkton | 0.29 | 0.45(-0.155)#66 | 0.48(-0.189)#3,314 |
| 67. | Green Isle | 0.29 | 0.45(-0.155)#67 | 0.48(-0.189)#3,318 |
| 68. | Beltrami | 0.29 | 0.45(-0.155)#68 | 0.48(-0.188)#3,331 |
| 69. | Magnolia | 0.30 | 0.45(-0.154)#69 | 0.48(-0.187)#3,384 |
| 70. | Cedar Mills | 0.30 | 0.45(-0.153)#70 | 0.48(-0.187)#3,407 |
| 71. | Good Thunder | 0.30 | 0.45(-0.153)#71 | 0.48(-0.186)#3,423 |
| 72. | Blomkest | 0.30 | 0.45(-0.153)#72 | 0.48(-0.186)#3,424 |
| 73. | Upsala | 0.30 | 0.45(-0.152)#73 | 0.48(-0.185)#3,462 |
| 74. | Delavan | 0.30 | 0.45(-0.152)#74 | 0.48(-0.185)#3,475 |
| 75. | Dalton | 0.30 | 0.45(-0.152)#75 | 0.48(-0.185)#3,485 |
| 76. | Otsego | 0.30 | 0.45(-0.151)#76 | 0.48(-0.184)#3,505 |
| 77. | Wilton | 0.30 | 0.45(-0.151)#77 | 0.48(-0.184)#3,522 |
| 78. | Millerville | 0.30 | 0.45(-0.150)#78 | 0.48(-0.184)#3,559 |
| 79. | Hancock | 0.30 | 0.45(-0.150)#79 | 0.48(-0.183)#3,562 |
| 80. | Dover | 0.30 | 0.45(-0.150)#80 | 0.48(-0.183)#3,591 |
| 81. | Bock | 0.30 | 0.45(-0.149)#81 | 0.48(-0.182)#3,617 |
| 82. | Watertown | 0.30 | 0.45(-0.148)#82 | 0.48(-0.181)#3,655 |
| 83. | Lancaster | 0.30 | 0.45(-0.148)#83 | 0.48(-0.181)#3,673 |
| 84. | Hazel Run | 0.30 | 0.45(-0.147)#84 | 0.48(-0.180)#3,704 |
| 85. | Chickamaw Beach | 0.30 | 0.45(-0.146)#85 | 0.48(-0.180)#3,749 |
| 86. | Shevlin | 0.30 | 0.45(-0.146)#86 | 0.48(-0.179)#3,766 |
| 87. | Strathcona | 0.30 | 0.45(-0.146)#87 | 0.48(-0.179)#3,781 |
| 88. | Silver Lake | 0.30 | 0.45(-0.146)#88 | 0.48(-0.179)#3,788 |
| 89. | Quamba | 0.30 | 0.45(-0.146)#89 | 0.48(-0.179)#3,798 |
| 90. | Esko | 0.30 | 0.45(-0.146)#90 | 0.48(-0.179)#3,805 |
| 91. | St Stephen | 0.30 | 0.45(-0.145)#91 | 0.48(-0.178)#3,827 |
| 92. | Nassau | 0.30 | 0.45(-0.145)#92 | 0.48(-0.178)#3,848 |
| 93. | Vesta | 0.30 | 0.45(-0.145)#93 | 0.48(-0.178)#3,852 |
| 94. | Regal | 0.31 | 0.45(-0.144)#94 | 0.48(-0.178)#3,878 |
| 95. | Columbus | 0.31 | 0.45(-0.144)#95 | 0.48(-0.177)#3,879 |
| 96. | Carlos | 0.31 | 0.45(-0.144)#96 | 0.48(-0.177)#3,918 |
| 97. | Holdingford | 0.31 | 0.45(-0.143)#97 | 0.48(-0.176)#3,951 |
| 98. | Pemberton | 0.31 | 0.45(-0.143)#98 | 0.48(-0.176)#3,959 |
| 99. | Montrose | 0.31 | 0.45(-0.142)#99 | 0.48(-0.175)#4,017 |
| 100. | Odin | 0.31 | 0.45(-0.142)#100 | 0.48(-0.175)#4,025 |
Common Questions
What are the Top 10 Cities with the Lowest Inequality / Gini Index in Minnesota?
Top 10 Cities with the Lowest Inequality / Gini Index in Minnesota are:
#1
0.04
#2
0.12
#3
0.14
#4
0.14
#5
0.16
#6
0.18
#7
0.18
#8
0.19
#9
0.20
#10
0.20
What city has the Lowest Inequality / Gini Index in Minnesota?
Barry has the Lowest Inequality / Gini Index in Minnesota with 0.04.
What is the Inequality / Gini Index in the State of Minnesota?
Inequality / Gini Index in Minnesota is 0.45.
What is the Inequality / Gini Index in the United States?
Inequality / Gini Index in the United States is 0.48.