Cities with the Highest Percentage of Households Heated by Utility Gas in Kentucky
RELATED REPORTS & OPTIONS
Utility Gas Heating
Kentucky
Compare Cities
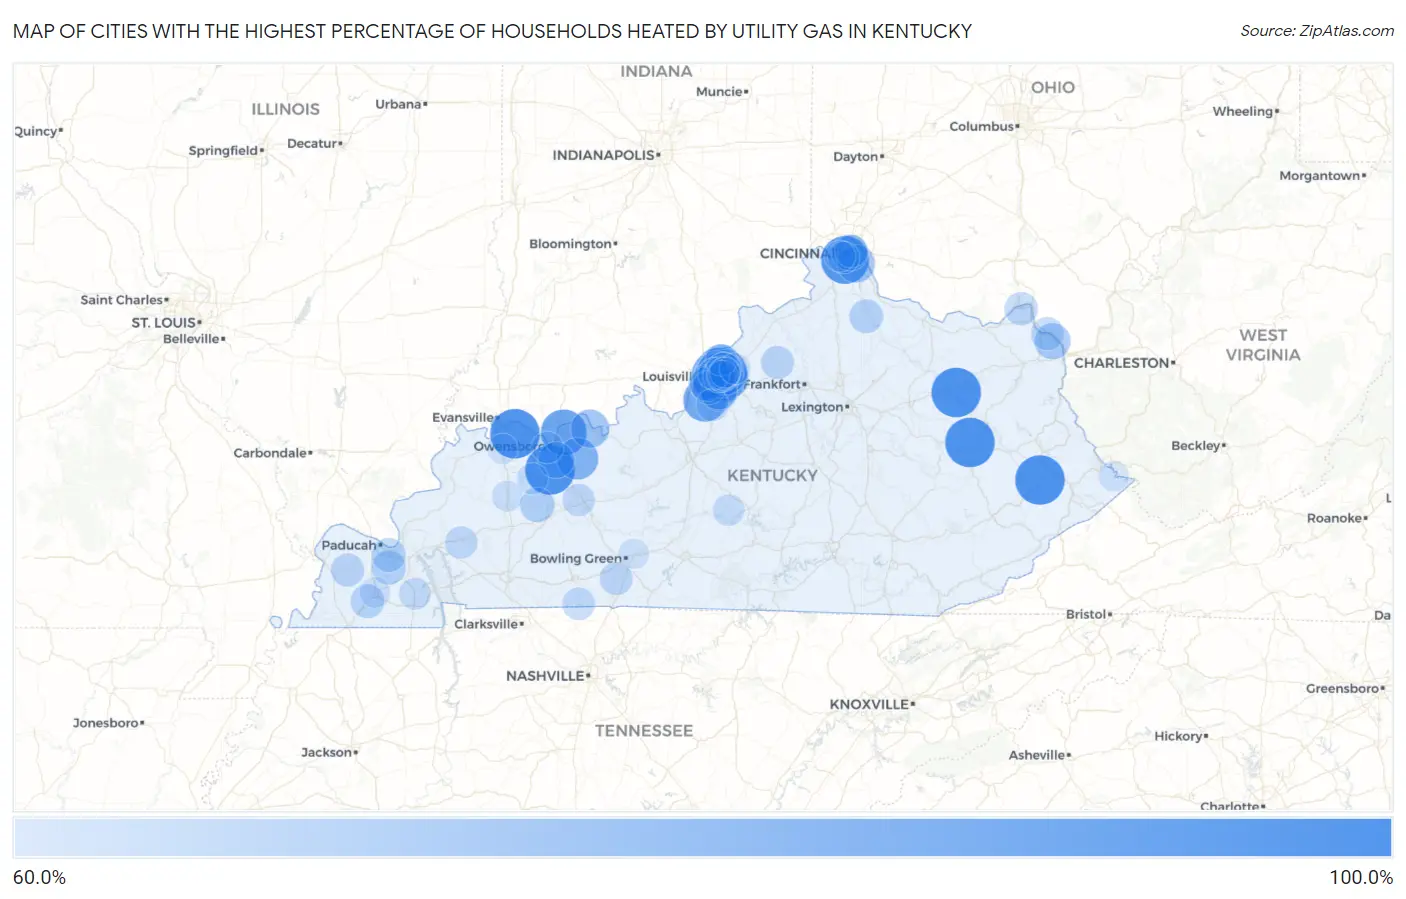
Map of Cities with the Highest Percentage of Households Heated by Utility Gas in Kentucky
0.0%
100.0%
Cities with the Highest Percentage of Households Heated by Utility Gas in Kentucky
| City | Utility Gas Heating | vs State | vs National | |
| 1. | Utica | 100.0% | 36.3%(+63.7)#1 | 47.1%(+52.9)#67 |
| 2. | Spottsville | 100.0% | 36.3%(+63.7)#2 | 47.1%(+52.9)#86 |
| 3. | Hazel Green | 100.0% | 36.3%(+63.7)#3 | 47.1%(+52.9)#203 |
| 4. | Farmers | 100.0% | 36.3%(+63.7)#4 | 47.1%(+52.9)#245 |
| 5. | Maytown | 100.0% | 36.3%(+63.7)#5 | 47.1%(+52.9)#268 |
| 6. | Kenton Vale | 97.1% | 36.3%(+60.8)#6 | 47.1%(+50.0)#361 |
| 7. | Westwood | 95.5% | 36.3%(+59.2)#7 | 47.1%(+48.4)#451 |
| 8. | Maceo | 93.9% | 36.3%(+57.6)#8 | 47.1%(+46.8)#615 |
| 9. | Glenview Hills | 90.2% | 36.3%(+53.9)#9 | 47.1%(+43.1)#1,245 |
| 10. | Hollyvilla | 90.0% | 36.3%(+53.7)#10 | 47.1%(+42.9)#1,292 |
| 11. | Old Brownsboro Place | 89.9% | 36.3%(+53.6)#11 | 47.1%(+42.8)#1,320 |
| 12. | Lincolnshire | 88.4% | 36.3%(+52.1)#12 | 47.1%(+41.3)#1,688 |
| 13. | Kingsley | 88.1% | 36.3%(+51.8)#13 | 47.1%(+41.0)#1,757 |
| 14. | Thornhill | 87.9% | 36.3%(+51.6)#14 | 47.1%(+40.8)#1,810 |
| 15. | Richlawn | 87.8% | 36.3%(+51.5)#15 | 47.1%(+40.7)#1,842 |
| 16. | Bancroft | 87.5% | 36.3%(+51.2)#16 | 47.1%(+40.4)#1,916 |
| 17. | Barbourmeade | 87.0% | 36.3%(+50.7)#17 | 47.1%(+39.9)#2,055 |
| 18. | Whitesville | 86.8% | 36.3%(+50.5)#18 | 47.1%(+39.7)#2,113 |
| 19. | Mockingbird Valley | 86.6% | 36.3%(+50.3)#19 | 47.1%(+39.5)#2,188 |
| 20. | Norwood | 86.2% | 36.3%(+49.9)#20 | 47.1%(+39.1)#2,315 |
| 21. | Glenview Manor | 85.2% | 36.3%(+48.9)#21 | 47.1%(+38.1)#2,671 |
| 22. | Bellewood | 84.8% | 36.3%(+48.5)#22 | 47.1%(+37.7)#2,790 |
| 23. | Green Spring | 84.6% | 36.3%(+48.3)#23 | 47.1%(+37.5)#2,857 |
| 24. | Forest Hills | 84.5% | 36.3%(+48.2)#24 | 47.1%(+37.4)#2,905 |
| 25. | Strathmoor Village | 84.2% | 36.3%(+47.9)#25 | 47.1%(+37.1)#3,011 |
| 26. | Druid Hills | 84.0% | 36.3%(+47.7)#26 | 47.1%(+36.9)#3,086 |
| 27. | Indian Hills | 83.8% | 36.3%(+47.5)#27 | 47.1%(+36.7)#3,146 |
| 28. | Brownsboro Village | 83.6% | 36.3%(+47.3)#28 | 47.1%(+36.5)#3,219 |
| 29. | Wildwood | 83.5% | 36.3%(+47.2)#29 | 47.1%(+36.4)#3,243 |
| 30. | Norbourne Estates | 83.3% | 36.3%(+47.0)#30 | 47.1%(+36.2)#3,294 |
| 31. | Wellington | 82.9% | 36.3%(+46.6)#31 | 47.1%(+35.8)#3,446 |
| 32. | Prospect | 82.7% | 36.3%(+46.4)#32 | 47.1%(+35.6)#3,506 |
| 33. | Crossgate | 82.1% | 36.3%(+45.8)#33 | 47.1%(+35.0)#3,730 |
| 34. | Hickory Hill | 81.6% | 36.3%(+45.3)#34 | 47.1%(+34.5)#3,937 |
| 35. | Seneca Gardens | 81.5% | 36.3%(+45.2)#35 | 47.1%(+34.4)#3,967 |
| 36. | Hawesville | 81.3% | 36.3%(+45.0)#36 | 47.1%(+34.2)#4,046 |
| 37. | Woodland Hills | 80.6% | 36.3%(+44.3)#37 | 47.1%(+33.5)#4,318 |
| 38. | Brownsboro Farm | 80.6% | 36.3%(+44.3)#38 | 47.1%(+33.5)#4,320 |
| 39. | Riverwood | 80.6% | 36.3%(+44.3)#39 | 47.1%(+33.5)#4,321 |
| 40. | Crestview | 80.4% | 36.3%(+44.1)#40 | 47.1%(+33.3)#4,393 |
| 41. | Rolling Hills | 80.0% | 36.3%(+43.7)#41 | 47.1%(+32.9)#4,548 |
| 42. | Anchorage | 79.6% | 36.3%(+43.3)#42 | 47.1%(+32.5)#4,706 |
| 43. | Houston Acres | 79.2% | 36.3%(+42.9)#43 | 47.1%(+32.1)#4,855 |
| 44. | Spring Valley | 79.1% | 36.3%(+42.8)#44 | 47.1%(+32.0)#4,891 |
| 45. | Meadow Vale | 79.0% | 36.3%(+42.7)#45 | 47.1%(+31.9)#4,921 |
| 46. | Spring Mill | 79.0% | 36.3%(+42.7)#46 | 47.1%(+31.9)#4,930 |
| 47. | St Regis Park | 78.4% | 36.3%(+42.1)#47 | 47.1%(+31.3)#5,168 |
| 48. | Creekside | 78.4% | 36.3%(+42.1)#48 | 47.1%(+31.3)#5,177 |
| 49. | Bellevue | 78.3% | 36.3%(+42.0)#49 | 47.1%(+31.2)#5,191 |
| 50. | Hollow Creek | 78.3% | 36.3%(+42.0)#50 | 47.1%(+31.2)#5,212 |
| 51. | Masonville | 78.0% | 36.3%(+41.7)#51 | 47.1%(+30.9)#5,294 |
| 52. | Goose Creek | 78.0% | 36.3%(+41.7)#52 | 47.1%(+30.9)#5,307 |
| 53. | Sorgho | 77.9% | 36.3%(+41.6)#53 | 47.1%(+30.8)#5,329 |
| 54. | Bellefonte | 77.9% | 36.3%(+41.6)#54 | 47.1%(+30.8)#5,335 |
| 55. | Glenview | 77.4% | 36.3%(+41.1)#55 | 47.1%(+30.3)#5,533 |
| 56. | Moseleyville | 77.3% | 36.3%(+41.0)#56 | 47.1%(+30.2)#5,577 |
| 57. | Maryhill Estates | 76.9% | 36.3%(+40.6)#57 | 47.1%(+29.8)#5,739 |
| 58. | Parkway Village | 76.6% | 36.3%(+40.3)#58 | 47.1%(+29.5)#5,862 |
| 59. | Manor Creek | 76.5% | 36.3%(+40.2)#59 | 47.1%(+29.4)#5,907 |
| 60. | Audubon Park | 76.1% | 36.3%(+39.8)#60 | 47.1%(+29.0)#6,056 |
| 61. | Ten Broeck | 75.8% | 36.3%(+39.5)#61 | 47.1%(+28.7)#6,208 |
| 62. | Bremen | 75.7% | 36.3%(+39.4)#62 | 47.1%(+28.6)#6,240 |
| 63. | Blue Ridge Manor | 75.3% | 36.3%(+39.0)#63 | 47.1%(+28.2)#6,380 |
| 64. | Symsonia | 75.0% | 36.3%(+38.7)#64 | 47.1%(+27.9)#6,476 |
| 65. | Reidland | 74.7% | 36.3%(+38.4)#65 | 47.1%(+27.6)#6,590 |
| 66. | Plantation | 74.5% | 36.3%(+38.2)#66 | 47.1%(+27.4)#6,687 |
| 67. | Falmouth | 74.3% | 36.3%(+38.0)#67 | 47.1%(+27.2)#6,761 |
| 68. | Pryorsburg | 74.3% | 36.3%(+38.0)#68 | 47.1%(+27.2)#6,782 |
| 69. | Lynnview | 73.6% | 36.3%(+37.3)#69 | 47.1%(+26.5)#7,044 |
| 70. | Cunningham | 73.6% | 36.3%(+37.3)#70 | 47.1%(+26.5)#7,049 |
| 71. | South Shore | 73.5% | 36.3%(+37.2)#71 | 47.1%(+26.4)#7,070 |
| 72. | Pleasureville | 73.4% | 36.3%(+37.1)#72 | 47.1%(+26.3)#7,110 |
| 73. | Worthington | 73.2% | 36.3%(+36.9)#73 | 47.1%(+26.1)#7,170 |
| 74. | Graymoor Devondale | 73.1% | 36.3%(+36.8)#74 | 47.1%(+26.0)#7,196 |
| 75. | Woodburn | 72.8% | 36.3%(+36.5)#75 | 47.1%(+25.7)#7,341 |
| 76. | Adairville | 72.5% | 36.3%(+36.2)#76 | 47.1%(+25.4)#7,439 |
| 77. | Dayton | 72.4% | 36.3%(+36.1)#77 | 47.1%(+25.3)#7,457 |
| 78. | Pioneer Village | 72.2% | 36.3%(+35.9)#78 | 47.1%(+25.1)#7,547 |
| 79. | Princeton | 72.1% | 36.3%(+35.8)#79 | 47.1%(+25.0)#7,572 |
| 80. | Beaver Dam | 72.1% | 36.3%(+35.8)#80 | 47.1%(+25.0)#7,576 |
| 81. | Beechwood Village | 71.7% | 36.3%(+35.4)#81 | 47.1%(+24.6)#7,710 |
| 82. | Moorland | 71.7% | 36.3%(+35.4)#82 | 47.1%(+24.6)#7,712 |
| 83. | Thruston | 71.3% | 36.3%(+35.0)#83 | 47.1%(+24.2)#7,862 |
| 84. | Dexter | 71.2% | 36.3%(+34.9)#84 | 47.1%(+24.1)#7,909 |
| 85. | Owensboro | 70.9% | 36.3%(+34.6)#85 | 47.1%(+23.8)#7,966 |
| 86. | Rolling Fields | 70.9% | 36.3%(+34.6)#86 | 47.1%(+23.8)#7,991 |
| 87. | River Bluff | 70.8% | 36.3%(+34.5)#87 | 47.1%(+23.7)#8,024 |
| 88. | Park Hills | 70.7% | 36.3%(+34.4)#88 | 47.1%(+23.6)#8,046 |
| 89. | Summersville | 70.7% | 36.3%(+34.4)#89 | 47.1%(+23.6)#8,062 |
| 90. | Calhoun | 70.4% | 36.3%(+34.1)#90 | 47.1%(+23.3)#8,154 |
| 91. | Hanson | 69.9% | 36.3%(+33.6)#91 | 47.1%(+22.8)#8,325 |
| 92. | Bellemeade | 69.9% | 36.3%(+33.6)#92 | 47.1%(+22.8)#8,326 |
| 93. | Pewee Valley | 69.7% | 36.3%(+33.4)#93 | 47.1%(+22.6)#8,383 |
| 94. | Philpot | 69.7% | 36.3%(+33.4)#94 | 47.1%(+22.6)#8,386 |
| 95. | Bromley | 69.5% | 36.3%(+33.2)#95 | 47.1%(+22.4)#8,441 |
| 96. | Mayfield | 69.4% | 36.3%(+33.1)#96 | 47.1%(+22.3)#8,453 |
| 97. | Freeburn | 69.0% | 36.3%(+32.7)#97 | 47.1%(+21.9)#8,605 |
| 98. | Meadowbrook Farm | 69.0% | 36.3%(+32.7)#98 | 47.1%(+21.9)#8,606 |
| 99. | Plum Springs | 68.8% | 36.3%(+32.5)#99 | 47.1%(+21.7)#8,671 |
| 100. | Anthoston | 68.8% | 36.3%(+32.5)#100 | 47.1%(+21.7)#8,674 |
Common Questions
What are the Top 10 Cities with the Highest Percentage of Households Heated by Utility Gas in Kentucky?
Top 10 Cities with the Highest Percentage of Households Heated by Utility Gas in Kentucky are:
#1
100.0%
#2
100.0%
#3
100.0%
#4
100.0%
#5
100.0%
#6
97.1%
#7
95.5%
#8
93.9%
#9
90.2%
#10
90.0%
What city has the Highest Percentage of Households Heated by Utility Gas in Kentucky?
Utica has the Highest Percentage of Households Heated by Utility Gas in Kentucky with 100.0%.
What is the Percentage of Households Heated by Utility Gas in the State of Kentucky?
Percentage of Households Heated by Utility Gas in Kentucky is 36.3%.
What is the Percentage of Households Heated by Utility Gas in the United States?
Percentage of Households Heated by Utility Gas in the United States is 47.1%.