Cities with the Highest Percentage of Households Heated by Utility Gas in Massachusetts
RELATED REPORTS & OPTIONS
Utility Gas Heating
Massachusetts
Compare Cities
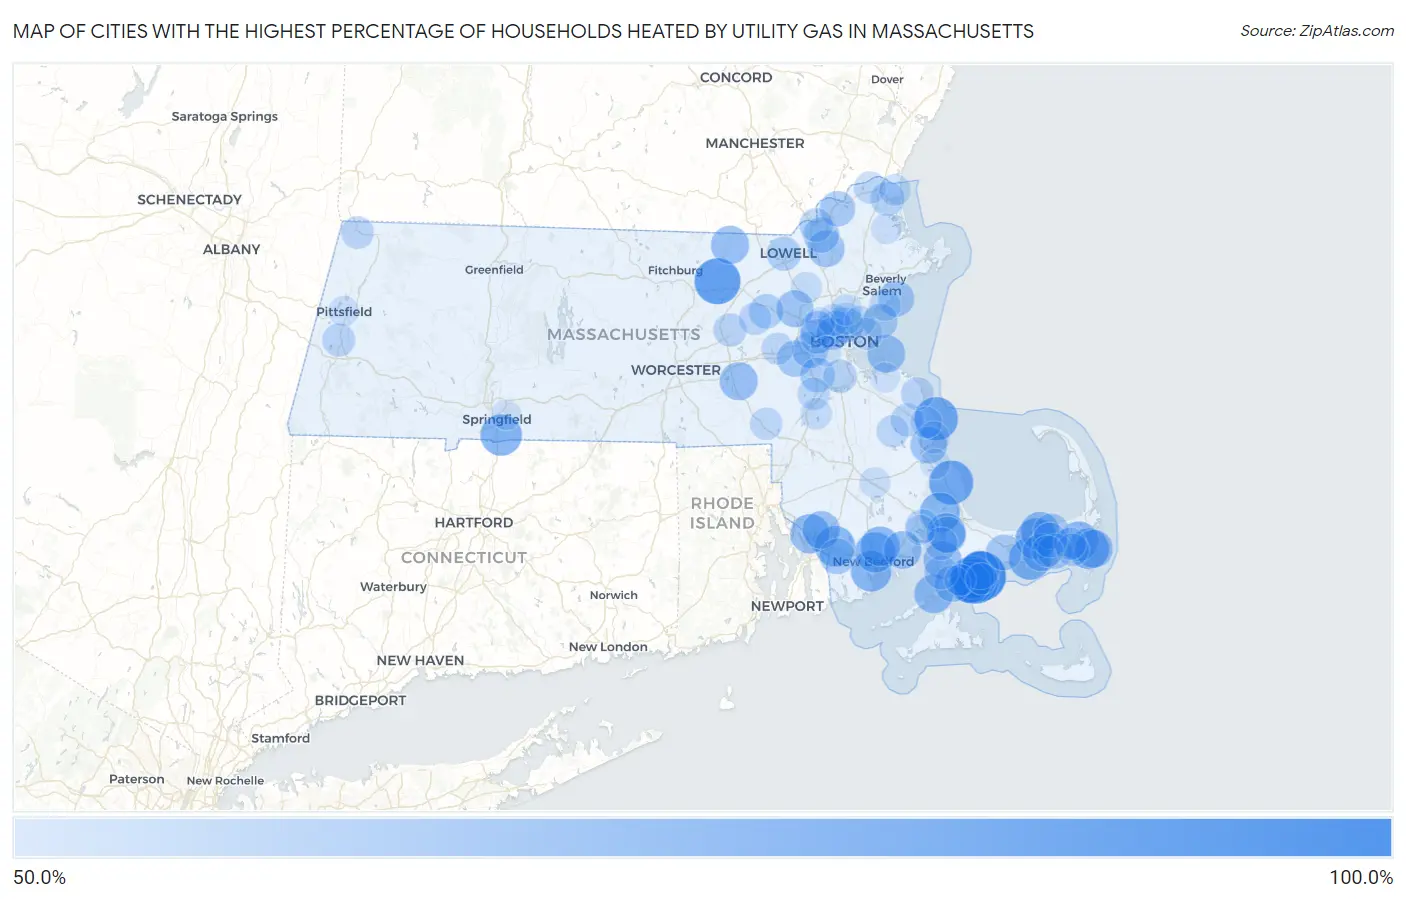
Map of Cities with the Highest Percentage of Households Heated by Utility Gas in Massachusetts
0.0%
100.0%
Cities with the Highest Percentage of Households Heated by Utility Gas in Massachusetts
| City | Utility Gas Heating | vs State | vs National | |
| 1. | Lenox Dale | 100.0% | 52.0%(+48.0)#1 | 47.1%(+52.9)#71 |
| 2. | Popponesset Island | 100.0% | 52.0%(+48.0)#2 | 47.1%(+52.9)#179 |
| 3. | Devens | 92.1% | 52.0%(+40.1)#3 | 47.1%(+45.0)#857 |
| 4. | New Seabury | 90.4% | 52.0%(+38.4)#4 | 47.1%(+43.3)#1,200 |
| 5. | Monomoscoy Island | 89.5% | 52.0%(+37.5)#5 | 47.1%(+42.4)#1,424 |
| 6. | The Pinehills | 88.3% | 52.0%(+36.3)#6 | 47.1%(+41.2)#1,698 |
| 7. | Green Harbor | 87.8% | 52.0%(+35.8)#7 | 47.1%(+40.7)#1,830 |
| 8. | Ocean Bluff Brant Rock | 86.8% | 52.0%(+34.8)#8 | 47.1%(+39.7)#2,099 |
| 9. | Seabrook | 85.2% | 52.0%(+33.2)#9 | 47.1%(+38.1)#2,663 |
| 10. | West Yarmouth | 83.8% | 52.0%(+31.8)#10 | 47.1%(+36.7)#3,145 |
| 11. | Longmeadow | 82.3% | 52.0%(+30.3)#11 | 47.1%(+35.2)#3,644 |
| 12. | Yarmouth Port | 82.1% | 52.0%(+30.1)#12 | 47.1%(+35.0)#3,706 |
| 13. | Seconsett Island | 81.5% | 52.0%(+29.5)#13 | 47.1%(+34.4)#3,972 |
| 14. | Bliss Corner | 80.9% | 52.0%(+28.9)#14 | 47.1%(+33.8)#4,186 |
| 15. | West Chatham | 80.9% | 52.0%(+28.9)#15 | 47.1%(+33.8)#4,199 |
| 16. | Fall River | 80.3% | 52.0%(+28.3)#16 | 47.1%(+33.2)#4,402 |
| 17. | New Bedford | 79.9% | 52.0%(+27.9)#17 | 47.1%(+32.8)#4,576 |
| 18. | White Island Shores | 79.7% | 52.0%(+27.7)#18 | 47.1%(+32.6)#4,665 |
| 19. | East Harwich | 78.6% | 52.0%(+26.6)#19 | 47.1%(+31.5)#5,081 |
| 20. | Ocean Grove | 78.2% | 52.0%(+26.2)#20 | 47.1%(+31.1)#5,237 |
| 21. | Acushnet Center | 78.1% | 52.0%(+26.1)#21 | 47.1%(+31.0)#5,270 |
| 22. | Dennis | 77.0% | 52.0%(+25.0)#22 | 47.1%(+29.9)#5,679 |
| 23. | Bourne | 77.0% | 52.0%(+25.0)#23 | 47.1%(+29.9)#5,682 |
| 24. | Mashpee Neck | 76.7% | 52.0%(+24.7)#24 | 47.1%(+29.6)#5,802 |
| 25. | Woods Hole | 76.7% | 52.0%(+24.7)#25 | 47.1%(+29.6)#5,804 |
| 26. | Chatham | 75.5% | 52.0%(+23.5)#26 | 47.1%(+28.4)#6,305 |
| 27. | East Pepperell | 75.3% | 52.0%(+23.3)#27 | 47.1%(+28.2)#6,373 |
| 28. | Hopkinton | 75.2% | 52.0%(+23.2)#28 | 47.1%(+28.1)#6,402 |
| 29. | Mattapoisett Center | 74.9% | 52.0%(+22.9)#29 | 47.1%(+27.8)#6,519 |
| 30. | North Falmouth | 74.9% | 52.0%(+22.9)#30 | 47.1%(+27.8)#6,522 |
| 31. | Hull | 74.8% | 52.0%(+22.8)#31 | 47.1%(+27.7)#6,544 |
| 32. | Somerset | 74.5% | 52.0%(+22.5)#32 | 47.1%(+27.4)#6,657 |
| 33. | South Yarmouth | 74.0% | 52.0%(+22.0)#33 | 47.1%(+26.9)#6,876 |
| 34. | Hanscom Afb | 73.0% | 52.0%(+21.0)#34 | 47.1%(+25.9)#7,247 |
| 35. | Andover | 72.8% | 52.0%(+20.8)#35 | 47.1%(+25.7)#7,312 |
| 36. | South Duxbury | 72.6% | 52.0%(+20.6)#36 | 47.1%(+25.5)#7,385 |
| 37. | Monument Beach | 72.1% | 52.0%(+20.1)#37 | 47.1%(+25.0)#7,578 |
| 38. | Cedar Crest | 71.7% | 52.0%(+19.7)#38 | 47.1%(+24.6)#7,705 |
| 39. | Teaticket | 71.6% | 52.0%(+19.6)#39 | 47.1%(+24.5)#7,742 |
| 40. | Wellesley | 71.2% | 52.0%(+19.2)#40 | 47.1%(+24.1)#7,879 |
| 41. | Newton | 71.0% | 52.0%(+19.0)#41 | 47.1%(+23.9)#7,939 |
| 42. | Marblehead | 70.9% | 52.0%(+18.9)#42 | 47.1%(+23.8)#7,973 |
| 43. | North Westport | 70.3% | 52.0%(+18.3)#43 | 47.1%(+23.2)#8,186 |
| 44. | Barnstable Town | 70.2% | 52.0%(+18.2)#44 | 47.1%(+23.1)#8,217 |
| 45. | Lawrence | 70.1% | 52.0%(+18.1)#45 | 47.1%(+23.0)#8,243 |
| 46. | Somerville | 70.1% | 52.0%(+18.1)#46 | 47.1%(+23.0)#8,244 |
| 47. | East Dennis | 69.9% | 52.0%(+17.9)#47 | 47.1%(+22.8)#8,314 |
| 48. | Haverhill | 69.7% | 52.0%(+17.7)#48 | 47.1%(+22.6)#8,373 |
| 49. | Belmont | 69.5% | 52.0%(+17.5)#49 | 47.1%(+22.4)#8,423 |
| 50. | Dennis Port | 69.0% | 52.0%(+17.0)#50 | 47.1%(+21.9)#8,582 |
| 51. | Nahant | 68.9% | 52.0%(+16.9)#51 | 47.1%(+21.8)#8,614 |
| 52. | South Dennis | 68.4% | 52.0%(+16.4)#52 | 47.1%(+21.3)#8,780 |
| 53. | Everett | 68.3% | 52.0%(+16.3)#53 | 47.1%(+21.2)#8,809 |
| 54. | Watertown Town | 68.3% | 52.0%(+16.3)#54 | 47.1%(+21.2)#8,810 |
| 55. | Dedham | 68.1% | 52.0%(+16.1)#55 | 47.1%(+21.0)#8,864 |
| 56. | West Concord | 67.9% | 52.0%(+15.9)#56 | 47.1%(+20.8)#8,939 |
| 57. | Lowell | 67.4% | 52.0%(+15.4)#57 | 47.1%(+20.3)#9,096 |
| 58. | West Falmouth | 66.8% | 52.0%(+14.8)#58 | 47.1%(+19.7)#9,295 |
| 59. | Newburyport | 66.6% | 52.0%(+14.6)#59 | 47.1%(+19.5)#9,371 |
| 60. | Wareham Center | 66.3% | 52.0%(+14.3)#60 | 47.1%(+19.2)#9,457 |
| 61. | Methuen Town | 66.1% | 52.0%(+14.1)#61 | 47.1%(+19.0)#9,514 |
| 62. | Milton | 65.8% | 52.0%(+13.8)#62 | 47.1%(+18.7)#9,615 |
| 63. | Hudson | 65.2% | 52.0%(+13.2)#63 | 47.1%(+18.1)#9,786 |
| 64. | North Pembroke | 65.1% | 52.0%(+13.1)#64 | 47.1%(+18.0)#9,822 |
| 65. | Lenox | 64.8% | 52.0%(+12.8)#65 | 47.1%(+17.7)#9,905 |
| 66. | Cambridge | 64.6% | 52.0%(+12.6)#66 | 47.1%(+17.5)#9,949 |
| 67. | Scituate | 64.2% | 52.0%(+12.2)#67 | 47.1%(+17.1)#10,070 |
| 68. | Pocasset | 64.2% | 52.0%(+12.2)#68 | 47.1%(+17.1)#10,074 |
| 69. | Harwich Port | 64.1% | 52.0%(+12.1)#69 | 47.1%(+17.0)#10,101 |
| 70. | Maynard | 63.9% | 52.0%(+11.9)#70 | 47.1%(+16.8)#10,158 |
| 71. | Williamstown | 63.9% | 52.0%(+11.9)#71 | 47.1%(+16.8)#10,159 |
| 72. | Norwood | 63.6% | 52.0%(+11.6)#72 | 47.1%(+16.5)#10,241 |
| 73. | Franklin Town | 63.3% | 52.0%(+11.3)#73 | 47.1%(+16.2)#10,331 |
| 74. | Harwich Center | 63.3% | 52.0%(+11.3)#74 | 47.1%(+16.2)#10,356 |
| 75. | Hanson | 63.0% | 52.0%(+11.0)#75 | 47.1%(+15.9)#10,437 |
| 76. | Amesbury Town | 62.8% | 52.0%(+10.8)#76 | 47.1%(+15.7)#10,472 |
| 77. | Cochituate | 62.8% | 52.0%(+10.8)#77 | 47.1%(+15.7)#10,473 |
| 78. | Winthrop Town | 62.7% | 52.0%(+10.7)#78 | 47.1%(+15.6)#10,496 |
| 79. | Duxbury | 62.7% | 52.0%(+10.7)#79 | 47.1%(+15.6)#10,509 |
| 80. | Medford | 62.3% | 52.0%(+10.3)#80 | 47.1%(+15.2)#10,618 |
| 81. | Malden | 62.1% | 52.0%(+10.1)#81 | 47.1%(+15.0)#10,661 |
| 82. | Salisbury | 62.0% | 52.0%(+10.00)#82 | 47.1%(+14.9)#10,702 |
| 83. | Marshfield | 62.0% | 52.0%(+10.00)#83 | 47.1%(+14.9)#10,704 |
| 84. | Swampscott | 61.8% | 52.0%(+9.80)#84 | 47.1%(+14.7)#10,751 |
| 85. | Sharon | 61.6% | 52.0%(+9.60)#85 | 47.1%(+14.5)#10,797 |
| 86. | East Falmouth | 61.5% | 52.0%(+9.50)#86 | 47.1%(+14.4)#10,808 |
| 87. | Melrose | 61.4% | 52.0%(+9.40)#87 | 47.1%(+14.3)#10,831 |
| 88. | West Dennis | 61.1% | 52.0%(+9.10)#88 | 47.1%(+14.0)#10,909 |
| 89. | Popponesset | 61.0% | 52.0%(+9.00)#89 | 47.1%(+13.9)#10,948 |
| 90. | Pinehurst | 60.7% | 52.0%(+8.70)#90 | 47.1%(+13.6)#10,995 |
| 91. | Revere | 60.5% | 52.0%(+8.50)#91 | 47.1%(+13.4)#11,033 |
| 92. | Middleborough Center | 60.3% | 52.0%(+8.30)#92 | 47.1%(+13.2)#11,074 |
| 93. | Arlington | 59.4% | 52.0%(+7.40)#93 | 47.1%(+12.3)#11,312 |
| 94. | Rowley | 59.4% | 52.0%(+7.40)#94 | 47.1%(+12.3)#11,324 |
| 95. | Pittsfield | 59.3% | 52.0%(+7.30)#95 | 47.1%(+12.2)#11,335 |
| 96. | Brookline | 59.1% | 52.0%(+7.10)#96 | 47.1%(+12.0)#11,392 |
| 97. | Hingham | 59.0% | 52.0%(+7.00)#97 | 47.1%(+11.9)#11,418 |
| 98. | Springfield | 58.8% | 52.0%(+6.80)#98 | 47.1%(+11.7)#11,464 |
| 99. | Plymouth | 58.8% | 52.0%(+6.80)#99 | 47.1%(+11.7)#11,472 |
| 100. | Weweantic | 58.7% | 52.0%(+6.70)#100 | 47.1%(+11.6)#11,507 |
Common Questions
What are the Top 10 Cities with the Highest Percentage of Households Heated by Utility Gas in Massachusetts?
Top 10 Cities with the Highest Percentage of Households Heated by Utility Gas in Massachusetts are:
#1
100.0%
#2
92.1%
#3
90.4%
#4
89.5%
#5
88.3%
#6
86.8%
#7
85.2%
#8
83.8%
#9
82.3%
#10
82.1%
What city has the Highest Percentage of Households Heated by Utility Gas in Massachusetts?
Popponesset Island has the Highest Percentage of Households Heated by Utility Gas in Massachusetts with 100.0%.
What is the Percentage of Households Heated by Utility Gas in the State of Massachusetts?
Percentage of Households Heated by Utility Gas in Massachusetts is 52.0%.
What is the Percentage of Households Heated by Utility Gas in the United States?
Percentage of Households Heated by Utility Gas in the United States is 47.1%.