Cities with the Highest Percentage of Households Heated by Utility Gas in Connecticut
RELATED REPORTS & OPTIONS
Utility Gas Heating
Connecticut
Compare Cities
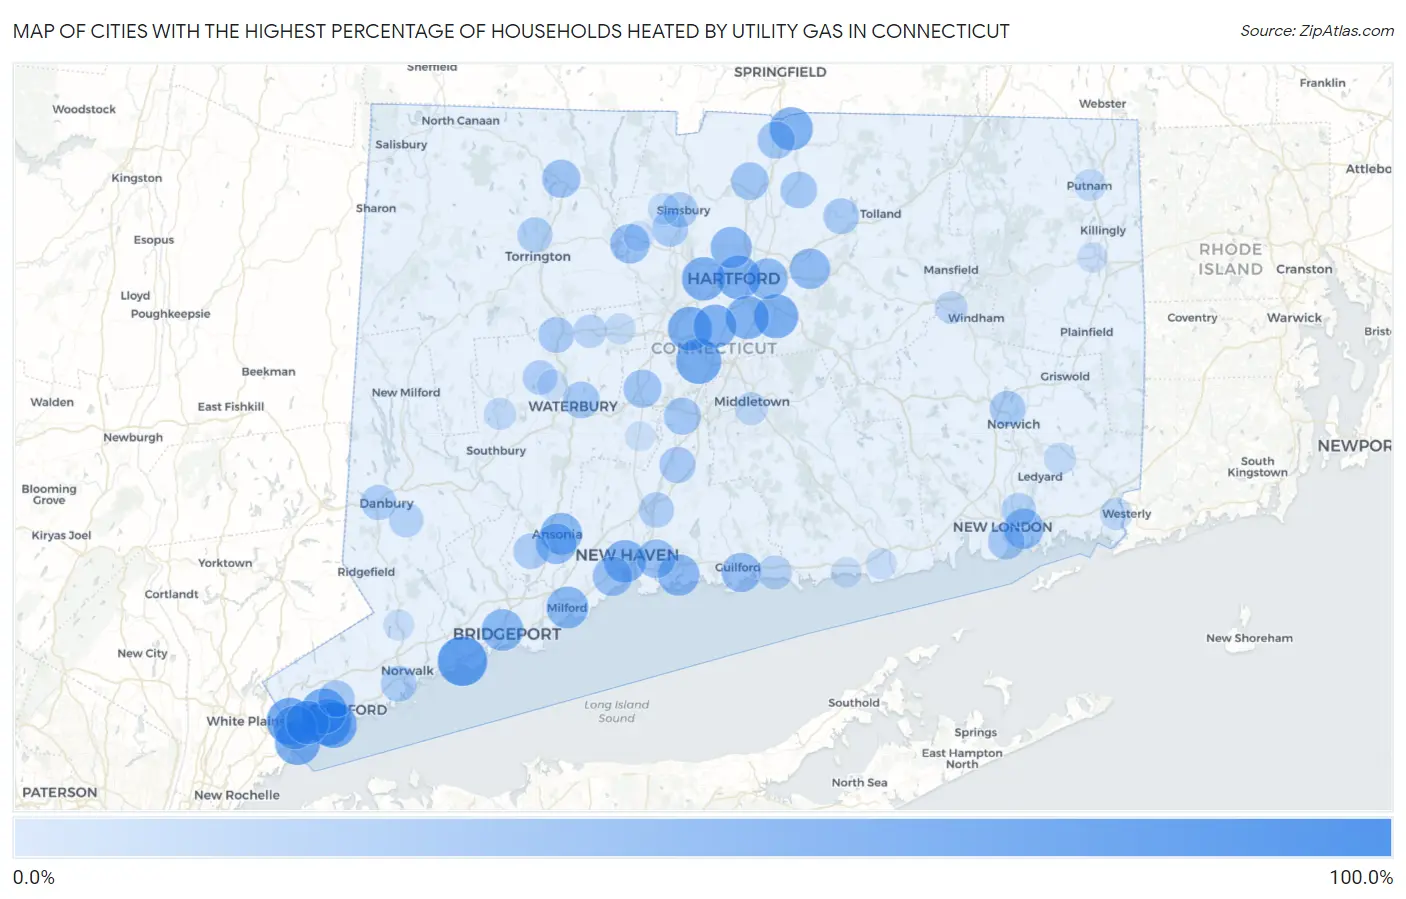
Map of Cities with the Highest Percentage of Households Heated by Utility Gas in Connecticut
0.0%
100.0%
Cities with the Highest Percentage of Households Heated by Utility Gas in Connecticut
| City | Utility Gas Heating | vs State | vs National | |
| 1. | Fairfield University | 100.0% | 36.6%(+63.4)#1 | 47.1%(+52.9)#3 |
| 2. | Southport | 86.9% | 36.6%(+50.3)#2 | 47.1%(+39.8)#2,081 |
| 3. | Glenville | 77.0% | 36.6%(+40.4)#3 | 47.1%(+29.9)#5,674 |
| 4. | Oronoque | 76.2% | 36.6%(+39.6)#4 | 47.1%(+29.1)#5,999 |
| 5. | Riverside | 75.8% | 36.6%(+39.2)#5 | 47.1%(+28.7)#6,173 |
| 6. | Mill Plain | 74.9% | 36.6%(+38.3)#6 | 47.1%(+27.8)#6,524 |
| 7. | Old Greenwich | 74.5% | 36.6%(+37.9)#7 | 47.1%(+27.4)#6,662 |
| 8. | Cos Cob | 72.9% | 36.6%(+36.3)#8 | 47.1%(+25.8)#7,275 |
| 9. | Kensington | 71.8% | 36.6%(+35.2)#9 | 47.1%(+24.7)#7,673 |
| 10. | Byram | 70.9% | 36.6%(+34.3)#10 | 47.1%(+23.8)#7,979 |
| 11. | Woodmont Borough | 70.8% | 36.6%(+34.2)#11 | 47.1%(+23.7)#8,013 |
| 12. | Rock Ridge | 70.1% | 36.6%(+33.5)#12 | 47.1%(+23.0)#8,265 |
| 13. | Indian Field | 69.2% | 36.6%(+32.6)#13 | 47.1%(+22.1)#8,534 |
| 14. | New Britain | 67.6% | 36.6%(+31.0)#14 | 47.1%(+20.5)#9,032 |
| 15. | Glastonbury Center | 67.5% | 36.6%(+30.9)#15 | 47.1%(+20.4)#9,069 |
| 16. | Hartford | 67.1% | 36.6%(+30.5)#16 | 47.1%(+20.0)#9,178 |
| 17. | Pemberwick | 65.9% | 36.6%(+29.3)#17 | 47.1%(+18.8)#9,587 |
| 18. | West Hartford | 65.5% | 36.6%(+28.9)#18 | 47.1%(+18.4)#9,702 |
| 19. | Greenwich | 65.4% | 36.6%(+28.8)#19 | 47.1%(+18.3)#9,737 |
| 20. | Tashua | 65.2% | 36.6%(+28.6)#20 | 47.1%(+18.1)#9,792 |
| 21. | Wethersfield | 64.8% | 36.6%(+28.2)#21 | 47.1%(+17.7)#9,897 |
| 22. | Newington | 64.6% | 36.6%(+28.0)#22 | 47.1%(+17.5)#9,953 |
| 23. | Sherwood Manor | 64.2% | 36.6%(+27.6)#23 | 47.1%(+17.1)#10,068 |
| 24. | Murray | 62.4% | 36.6%(+25.8)#24 | 47.1%(+15.3)#10,606 |
| 25. | New Haven | 61.6% | 36.6%(+25.0)#25 | 47.1%(+14.5)#10,791 |
| 26. | Lordship | 60.3% | 36.6%(+23.7)#26 | 47.1%(+13.2)#11,077 |
| 27. | Milford City Balance | 59.4% | 36.6%(+22.8)#27 | 47.1%(+12.3)#11,310 |
| 28. | Bridgeport | 58.6% | 36.6%(+22.0)#28 | 47.1%(+11.5)#11,520 |
| 29. | Ansonia | 58.5% | 36.6%(+21.9)#29 | 47.1%(+11.4)#11,557 |
| 30. | Branford Center | 58.1% | 36.6%(+21.5)#30 | 47.1%(+11.0)#11,671 |
| 31. | Blue Hills | 57.3% | 36.6%(+20.7)#31 | 47.1%(+10.2)#11,886 |
| 32. | Stratford Downtown | 56.4% | 36.6%(+19.8)#32 | 47.1%(+9.30)#12,094 |
| 33. | East Hartford | 55.1% | 36.6%(+18.5)#33 | 47.1%(+8.00)#12,399 |
| 34. | Derby | 54.9% | 36.6%(+18.3)#34 | 47.1%(+7.80)#12,455 |
| 35. | Manchester | 54.4% | 36.6%(+17.8)#35 | 47.1%(+7.30)#12,575 |
| 36. | Daniels Farm | 53.5% | 36.6%(+16.9)#36 | 47.1%(+6.40)#12,793 |
| 37. | Long Hill | 53.1% | 36.6%(+16.5)#37 | 47.1%(+6.00)#12,874 |
| 38. | West Haven | 51.1% | 36.6%(+14.5)#38 | 47.1%(+4.00)#13,315 |
| 39. | Collinsville | 50.8% | 36.6%(+14.2)#39 | 47.1%(+3.70)#13,391 |
| 40. | Guilford Center | 50.6% | 36.6%(+14.0)#40 | 47.1%(+3.50)#13,429 |
| 41. | Greens Farms | 50.2% | 36.6%(+13.6)#41 | 47.1%(+3.10)#13,517 |
| 42. | East Haven | 48.9% | 36.6%(+12.3)#42 | 47.1%(+1.80)#13,783 |
| 43. | Plattsville | 46.8% | 36.6%(+10.2)#43 | 47.1%(-0.300)#14,252 |
| 44. | Winsted | 46.3% | 36.6%(+9.70)#44 | 47.1%(-0.800)#14,350 |
| 45. | Plantsville | 45.7% | 36.6%(+9.10)#45 | 47.1%(-1.40)#14,479 |
| 46. | Windsor Locks | 44.2% | 36.6%(+7.60)#46 | 47.1%(-2.90)#14,756 |
| 47. | Thompsonville | 43.7% | 36.6%(+7.10)#47 | 47.1%(-3.40)#14,827 |
| 48. | Meriden | 42.4% | 36.6%(+5.80)#48 | 47.1%(-4.70)#15,049 |
| 49. | Staples | 41.9% | 36.6%(+5.30)#49 | 47.1%(-5.20)#15,141 |
| 50. | Stamford | 41.4% | 36.6%(+4.80)#50 | 47.1%(-5.70)#15,232 |
| 51. | Broad Brook | 41.2% | 36.6%(+4.60)#51 | 47.1%(-5.90)#15,274 |
| 52. | Waterbury | 41.1% | 36.6%(+4.50)#52 | 47.1%(-6.00)#15,291 |
| 53. | New London | 40.9% | 36.6%(+4.30)#53 | 47.1%(-6.20)#15,329 |
| 54. | Trumbull Center | 40.8% | 36.6%(+4.20)#54 | 47.1%(-6.30)#15,344 |
| 55. | Wallingford Center | 39.8% | 36.6%(+3.20)#55 | 47.1%(-7.30)#15,540 |
| 56. | Weatogue | 39.1% | 36.6%(+2.50)#56 | 47.1%(-8.00)#15,659 |
| 57. | Compo | 39.0% | 36.6%(+2.40)#57 | 47.1%(-8.10)#15,679 |
| 58. | Rockville | 38.4% | 36.6%(+1.80)#58 | 47.1%(-8.70)#15,794 |
| 59. | Norwich | 38.1% | 36.6%(+1.50)#59 | 47.1%(-9.00)#15,827 |
| 60. | Thomaston | 38.1% | 36.6%(+1.50)#60 | 47.1%(-9.00)#15,837 |
| 61. | Norwalk | 37.8% | 36.6%(+1.20)#61 | 47.1%(-9.30)#15,888 |
| 62. | Shelton | 37.4% | 36.6%(+0.800)#62 | 47.1%(-9.70)#15,954 |
| 63. | Simsbury Center | 36.8% | 36.6%(+0.200)#63 | 47.1%(-10.3)#16,062 |
| 64. | North Haven | 36.4% | 36.6%(-0.200)#64 | 47.1%(-10.7)#16,119 |
| 65. | Torrington | 36.1% | 36.6%(-0.500)#65 | 47.1%(-11.0)#16,166 |
| 66. | Stepney | 35.9% | 36.6%(-0.700)#66 | 47.1%(-11.2)#16,205 |
| 67. | Danbury | 35.8% | 36.6%(-0.800)#67 | 47.1%(-11.3)#16,219 |
| 68. | East | 34.8% | 36.6%(-1.80)#68 | 47.1%(-12.3)#16,405 |
| 69. | Danielson Borough | 34.3% | 36.6%(-2.30)#69 | 47.1%(-12.8)#16,500 |
| 70. | Watertown | 33.9% | 36.6%(-2.70)#70 | 47.1%(-13.2)#16,568 |
| 71. | Bethel | 33.7% | 36.6%(-2.90)#71 | 47.1%(-13.4)#16,589 |
| 72. | Poplar Plains | 32.9% | 36.6%(-3.70)#72 | 47.1%(-14.2)#16,740 |
| 73. | Conning Towers Nautilus Park | 32.7% | 36.6%(-3.90)#73 | 47.1%(-14.4)#16,761 |
| 74. | Route 7 Gateway | 31.3% | 36.6%(-5.30)#74 | 47.1%(-15.8)#16,981 |
| 75. | Madison Center | 31.2% | 36.6%(-5.40)#75 | 47.1%(-15.9)#17,002 |
| 76. | Terryville | 29.6% | 36.6%(-7.00)#76 | 47.1%(-17.5)#17,237 |
| 77. | Naugatuck Borough | 29.2% | 36.6%(-7.40)#77 | 47.1%(-17.9)#17,304 |
| 78. | Dodgingtown | 29.1% | 36.6%(-7.50)#78 | 47.1%(-18.0)#17,344 |
| 79. | Middletown | 27.7% | 36.6%(-8.90)#79 | 47.1%(-19.4)#17,534 |
| 80. | Willimantic | 26.7% | 36.6%(-9.90)#80 | 47.1%(-20.4)#17,692 |
| 81. | Pawcatuck | 26.7% | 36.6%(-9.90)#81 | 47.1%(-20.4)#17,694 |
| 82. | Newtown Borough | 25.5% | 36.6%(-11.1)#82 | 47.1%(-21.6)#17,865 |
| 83. | Woodbury Center | 25.3% | 36.6%(-11.3)#83 | 47.1%(-21.8)#17,904 |
| 84. | Mashantucket | 25.0% | 36.6%(-11.6)#84 | 47.1%(-22.1)#17,967 |
| 85. | Putnam | 24.7% | 36.6%(-11.9)#85 | 47.1%(-22.4)#18,013 |
| 86. | West Simsbury | 24.0% | 36.6%(-12.6)#86 | 47.1%(-23.1)#18,119 |
| 87. | Coleytown | 23.9% | 36.6%(-12.7)#87 | 47.1%(-23.2)#18,137 |
| 88. | Bristol | 22.9% | 36.6%(-13.7)#88 | 47.1%(-24.2)#18,288 |
| 89. | Saugatuck | 22.5% | 36.6%(-14.1)#89 | 47.1%(-24.6)#18,357 |
| 90. | Ridgebury | 22.1% | 36.6%(-14.5)#90 | 47.1%(-25.0)#18,432 |
| 91. | Old Saybrook Center | 21.5% | 36.6%(-15.1)#91 | 47.1%(-25.6)#18,518 |
| 92. | New Canaan | 21.4% | 36.6%(-15.2)#92 | 47.1%(-25.7)#18,528 |
| 93. | Westport | 21.4% | 36.6%(-15.2)#93 | 47.1%(-25.7)#18,533 |
| 94. | South Wilton | 21.4% | 36.6%(-15.2)#94 | 47.1%(-25.7)#18,537 |
| 95. | Oakville | 21.3% | 36.6%(-15.3)#95 | 47.1%(-25.8)#18,549 |
| 96. | Wilton Center | 21.1% | 36.6%(-15.5)#96 | 47.1%(-26.0)#18,594 |
| 97. | Westbrook Center | 20.4% | 36.6%(-16.2)#97 | 47.1%(-26.7)#18,687 |
| 98. | East Brooklyn | 19.6% | 36.6%(-17.0)#98 | 47.1%(-27.5)#18,808 |
| 99. | Canton Valley | 19.4% | 36.6%(-17.2)#99 | 47.1%(-27.7)#18,837 |
| 100. | Cheshire Village | 18.1% | 36.6%(-18.5)#100 | 47.1%(-29.0)#19,014 |
Common Questions
What are the Top 10 Cities with the Highest Percentage of Households Heated by Utility Gas in Connecticut?
Top 10 Cities with the Highest Percentage of Households Heated by Utility Gas in Connecticut are:
#1
86.9%
#2
77.0%
#3
75.8%
#4
74.5%
#5
72.9%
#6
71.8%
#7
70.9%
#8
67.6%
#9
67.5%
#10
67.1%
What city has the Highest Percentage of Households Heated by Utility Gas in Connecticut?
Southport has the Highest Percentage of Households Heated by Utility Gas in Connecticut with 86.9%.
What is the Percentage of Households Heated by Utility Gas in the State of Connecticut?
Percentage of Households Heated by Utility Gas in Connecticut is 36.6%.
What is the Percentage of Households Heated by Utility Gas in the United States?
Percentage of Households Heated by Utility Gas in the United States is 47.1%.