Cities with the Highest Percentage of Polish Population in Massachusetts
RELATED REPORTS & OPTIONS
Polish
Massachusetts
Compare Cities
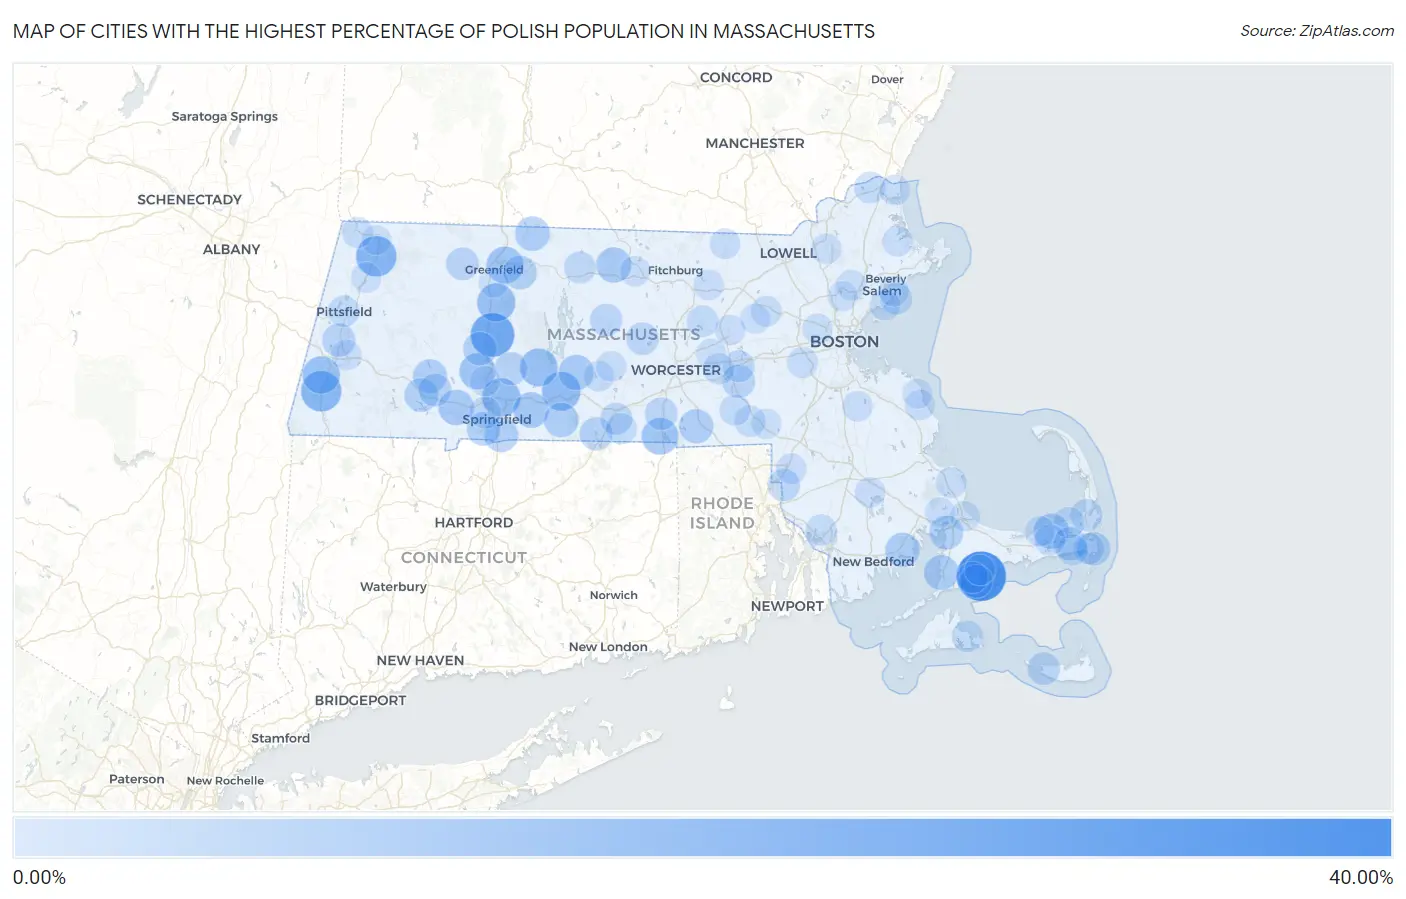
Map of Cities with the Highest Percentage of Polish Population in Massachusetts
0.00%
40.00%
Cities with the Highest Percentage of Polish Population in Massachusetts
| City | Polish | vs State | vs National | |
| 1. | Popponesset Island | 31.43% | 3.94%(+27.5)#1 | 2.61%(+28.8)#96 |
| 2. | Hatfield | 23.07% | 3.94%(+19.1)#2 | 2.61%(+20.5)#249 |
| 3. | Adams | 18.59% | 3.94%(+14.7)#3 | 2.61%(+16.0)#403 |
| 4. | Great Barrington | 18.41% | 3.94%(+14.5)#4 | 2.61%(+15.8)#418 |
| 5. | Palmer Town | 16.14% | 3.94%(+12.2)#5 | 2.61%(+13.5)#582 |
| 6. | Chicopee | 15.73% | 3.94%(+11.8)#6 | 2.61%(+13.1)#627 |
| 7. | South Deerfield | 15.16% | 3.94%(+11.2)#7 | 2.61%(+12.5)#677 |
| 8. | Belchertown | 14.84% | 3.94%(+10.9)#8 | 2.61%(+12.2)#719 |
| 9. | Housatonic | 14.21% | 3.94%(+10.3)#9 | 2.61%(+11.6)#798 |
| 10. | Turners Falls | 13.37% | 3.94%(+9.43)#10 | 2.61%(+10.8)#906 |
| 11. | Webster | 13.21% | 3.94%(+9.27)#11 | 2.61%(+10.6)#935 |
| 12. | Easthampton Town | 12.67% | 3.94%(+8.73)#12 | 2.61%(+10.1)#1,011 |
| 13. | Wilbraham | 11.72% | 3.94%(+7.79)#13 | 2.61%(+9.11)#1,215 |
| 14. | Westfield | 11.45% | 3.94%(+7.51)#14 | 2.61%(+8.84)#1,281 |
| 15. | East Dennis | 11.40% | 3.94%(+7.46)#15 | 2.61%(+8.79)#1,296 |
| 16. | Baldwinville | 11.20% | 3.94%(+7.26)#16 | 2.61%(+8.59)#1,339 |
| 17. | Ware | 11.18% | 3.94%(+7.24)#17 | 2.61%(+8.57)#1,349 |
| 18. | West Falmouth | 10.54% | 3.94%(+6.61)#18 | 2.61%(+7.93)#1,511 |
| 19. | Northfield | 10.24% | 3.94%(+6.31)#19 | 2.61%(+7.63)#1,595 |
| 20. | Monson Center | 10.16% | 3.94%(+6.23)#20 | 2.61%(+7.55)#1,616 |
| 21. | Mattapoisett Center | 9.94% | 3.94%(+6.01)#21 | 2.61%(+7.33)#1,676 |
| 22. | Greenfield | 9.87% | 3.94%(+5.93)#22 | 2.61%(+7.26)#1,707 |
| 23. | East Douglas | 9.80% | 3.94%(+5.86)#23 | 2.61%(+7.19)#1,731 |
| 24. | Longmeadow | 9.60% | 3.94%(+5.67)#24 | 2.61%(+6.99)#1,798 |
| 25. | Huntington | 9.48% | 3.94%(+5.54)#25 | 2.61%(+6.87)#1,846 |
| 26. | Bourne | 9.37% | 3.94%(+5.44)#26 | 2.61%(+6.76)#1,884 |
| 27. | Agawam Town | 9.26% | 3.94%(+5.33)#27 | 2.61%(+6.65)#1,918 |
| 28. | Blandford | 9.17% | 3.94%(+5.23)#28 | 2.61%(+6.56)#1,943 |
| 29. | Millers Falls | 8.95% | 3.94%(+5.02)#29 | 2.61%(+6.34)#2,019 |
| 30. | Harwich Center | 8.88% | 3.94%(+4.94)#30 | 2.61%(+6.27)#2,044 |
| 31. | Northampton | 8.87% | 3.94%(+4.93)#31 | 2.61%(+6.26)#2,047 |
| 32. | Chatham | 8.55% | 3.94%(+4.62)#32 | 2.61%(+5.94)#2,187 |
| 33. | Lenox | 8.45% | 3.94%(+4.52)#33 | 2.61%(+5.84)#2,246 |
| 34. | Holland | 8.20% | 3.94%(+4.26)#34 | 2.61%(+5.58)#2,373 |
| 35. | New Seabury | 8.13% | 3.94%(+4.19)#35 | 2.61%(+5.52)#2,402 |
| 36. | Russell | 8.03% | 3.94%(+4.09)#36 | 2.61%(+5.42)#2,453 |
| 37. | Hopkinton | 7.88% | 3.94%(+3.95)#37 | 2.61%(+5.27)#2,522 |
| 38. | Granby | 7.74% | 3.94%(+3.80)#38 | 2.61%(+5.13)#2,572 |
| 39. | Shelburne Falls | 7.65% | 3.94%(+3.72)#39 | 2.61%(+5.04)#2,618 |
| 40. | Madaket | 7.55% | 3.94%(+3.61)#40 | 2.61%(+4.94)#2,672 |
| 41. | Rutland | 7.51% | 3.94%(+3.58)#41 | 2.61%(+4.90)#2,691 |
| 42. | Oxford | 7.50% | 3.94%(+3.57)#42 | 2.61%(+4.89)#2,700 |
| 43. | North Seekonk | 7.30% | 3.94%(+3.36)#43 | 2.61%(+4.69)#2,845 |
| 44. | Barre | 7.24% | 3.94%(+3.30)#44 | 2.61%(+4.63)#2,891 |
| 45. | Sturbridge | 6.98% | 3.94%(+3.04)#45 | 2.61%(+4.36)#3,060 |
| 46. | Athol | 6.73% | 3.94%(+2.80)#46 | 2.61%(+4.12)#3,210 |
| 47. | Orleans | 6.73% | 3.94%(+2.79)#47 | 2.61%(+4.12)#3,215 |
| 48. | Marblehead | 6.62% | 3.94%(+2.69)#48 | 2.61%(+4.01)#3,281 |
| 49. | Cordaville | 6.62% | 3.94%(+2.69)#49 | 2.61%(+4.01)#3,283 |
| 50. | West Springfield Town | 6.52% | 3.94%(+2.59)#50 | 2.61%(+3.91)#3,357 |
| 51. | Amesbury Town | 6.10% | 3.94%(+2.16)#51 | 2.61%(+3.49)#3,689 |
| 52. | Clinton | 6.07% | 3.94%(+2.14)#52 | 2.61%(+3.46)#3,704 |
| 53. | Pittsfield | 6.01% | 3.94%(+2.07)#53 | 2.61%(+3.40)#3,767 |
| 54. | Edgartown | 5.90% | 3.94%(+1.97)#54 | 2.61%(+3.29)#3,851 |
| 55. | Seabrook | 5.88% | 3.94%(+1.95)#55 | 2.61%(+3.27)#3,862 |
| 56. | West Chatham | 5.82% | 3.94%(+1.88)#56 | 2.61%(+3.21)#3,923 |
| 57. | Westborough | 5.77% | 3.94%(+1.84)#57 | 2.61%(+3.16)#3,969 |
| 58. | Bellingham | 5.74% | 3.94%(+1.80)#58 | 2.61%(+3.13)#4,009 |
| 59. | Somerset | 5.64% | 3.94%(+1.70)#59 | 2.61%(+3.03)#4,101 |
| 60. | Brewster | 5.64% | 3.94%(+1.70)#60 | 2.61%(+3.02)#4,106 |
| 61. | Southbridge Town | 5.63% | 3.94%(+1.69)#61 | 2.61%(+3.01)#4,122 |
| 62. | Harwich Port | 5.60% | 3.94%(+1.66)#62 | 2.61%(+2.98)#4,153 |
| 63. | Hopedale | 5.51% | 3.94%(+1.58)#63 | 2.61%(+2.90)#4,249 |
| 64. | South Dennis | 5.45% | 3.94%(+1.51)#64 | 2.61%(+2.84)#4,307 |
| 65. | Needham | 5.34% | 3.94%(+1.40)#65 | 2.61%(+2.73)#4,410 |
| 66. | The Pinehills | 5.31% | 3.94%(+1.37)#66 | 2.61%(+2.69)#4,440 |
| 67. | Williamstown | 5.25% | 3.94%(+1.31)#67 | 2.61%(+2.64)#4,507 |
| 68. | West Concord | 5.18% | 3.94%(+1.24)#68 | 2.61%(+2.57)#4,567 |
| 69. | North Attleborough | 5.14% | 3.94%(+1.20)#69 | 2.61%(+2.53)#4,616 |
| 70. | Pepperell | 4.99% | 3.94%(+1.05)#70 | 2.61%(+2.38)#4,784 |
| 71. | West Brookfield | 4.96% | 3.94%(+1.03)#71 | 2.61%(+2.35)#4,819 |
| 72. | Swampscott | 4.93% | 3.94%(+0.997)#72 | 2.61%(+2.32)#4,851 |
| 73. | North Brookfield | 4.92% | 3.94%(+0.989)#73 | 2.61%(+2.31)#4,860 |
| 74. | Attleboro | 4.92% | 3.94%(+0.985)#74 | 2.61%(+2.31)#4,865 |
| 75. | Salisbury | 4.90% | 3.94%(+0.961)#75 | 2.61%(+2.29)#4,898 |
| 76. | Shirley | 4.86% | 3.94%(+0.921)#76 | 2.61%(+2.25)#4,941 |
| 77. | Lee | 4.84% | 3.94%(+0.909)#77 | 2.61%(+2.23)#4,953 |
| 78. | Andover | 4.79% | 3.94%(+0.853)#78 | 2.61%(+2.18)#5,012 |
| 79. | White Island Shores | 4.77% | 3.94%(+0.833)#79 | 2.61%(+2.16)#5,033 |
| 80. | Cheshire | 4.75% | 3.94%(+0.818)#80 | 2.61%(+2.14)#5,056 |
| 81. | Ipswich | 4.74% | 3.94%(+0.806)#81 | 2.61%(+2.13)#5,073 |
| 82. | Holbrook | 4.73% | 3.94%(+0.792)#82 | 2.61%(+2.12)#5,087 |
| 83. | Salem | 4.71% | 3.94%(+0.775)#83 | 2.61%(+2.10)#5,101 |
| 84. | Holyoke | 4.69% | 3.94%(+0.757)#84 | 2.61%(+2.08)#5,127 |
| 85. | Hudson | 4.68% | 3.94%(+0.743)#85 | 2.61%(+2.07)#5,139 |
| 86. | Marshfield Hills | 4.68% | 3.94%(+0.743)#86 | 2.61%(+2.07)#5,140 |
| 87. | North Lakeville | 4.65% | 3.94%(+0.714)#87 | 2.61%(+2.04)#5,183 |
| 88. | Mashpee Neck | 4.65% | 3.94%(+0.710)#88 | 2.61%(+2.03)#5,185 |
| 89. | Gardner | 4.61% | 3.94%(+0.678)#89 | 2.61%(+2.00)#5,219 |
| 90. | Lynnfield | 4.60% | 3.94%(+0.668)#90 | 2.61%(+1.99)#5,226 |
| 91. | Belmont | 4.57% | 3.94%(+0.636)#91 | 2.61%(+1.96)#5,267 |
| 92. | Dennis | 4.53% | 3.94%(+0.596)#92 | 2.61%(+1.92)#5,325 |
| 93. | Wakefield | 4.43% | 3.94%(+0.497)#93 | 2.61%(+1.82)#5,443 |
| 94. | Sagamore | 4.41% | 3.94%(+0.477)#94 | 2.61%(+1.80)#5,457 |
| 95. | Maynard | 4.38% | 3.94%(+0.441)#95 | 2.61%(+1.77)#5,505 |
| 96. | Franklin Town | 4.35% | 3.94%(+0.418)#96 | 2.61%(+1.74)#5,539 |
| 97. | Deerfield | 4.32% | 3.94%(+0.386)#97 | 2.61%(+1.71)#5,576 |
| 98. | Northborough | 4.25% | 3.94%(+0.318)#98 | 2.61%(+1.64)#5,684 |
| 99. | North Adams | 4.25% | 3.94%(+0.316)#99 | 2.61%(+1.64)#5,690 |
| 100. | Scituate | 4.24% | 3.94%(+0.310)#100 | 2.61%(+1.63)#5,702 |
Common Questions
What are the Top 10 Cities with the Highest Percentage of Polish Population in Massachusetts?
Top 10 Cities with the Highest Percentage of Polish Population in Massachusetts are:
#1
31.43%
#2
23.07%
#3
18.59%
#4
18.41%
#5
16.14%
#6
15.73%
#7
15.16%
#8
14.84%
#9
14.21%
#10
13.37%
What city has the Highest Percentage of Polish Population in Massachusetts?
Popponesset Island has the Highest Percentage of Polish Population in Massachusetts with 31.43%.
What is the Percentage of Polish Population in the State of Massachusetts?
Percentage of Polish Population in Massachusetts is 3.94%.
What is the Percentage of Polish Population in the United States?
Percentage of Polish Population in the United States is 2.61%.