Cities with the Highest Percentage of Polish Population in Connecticut
RELATED REPORTS & OPTIONS
Polish
Connecticut
Compare Cities
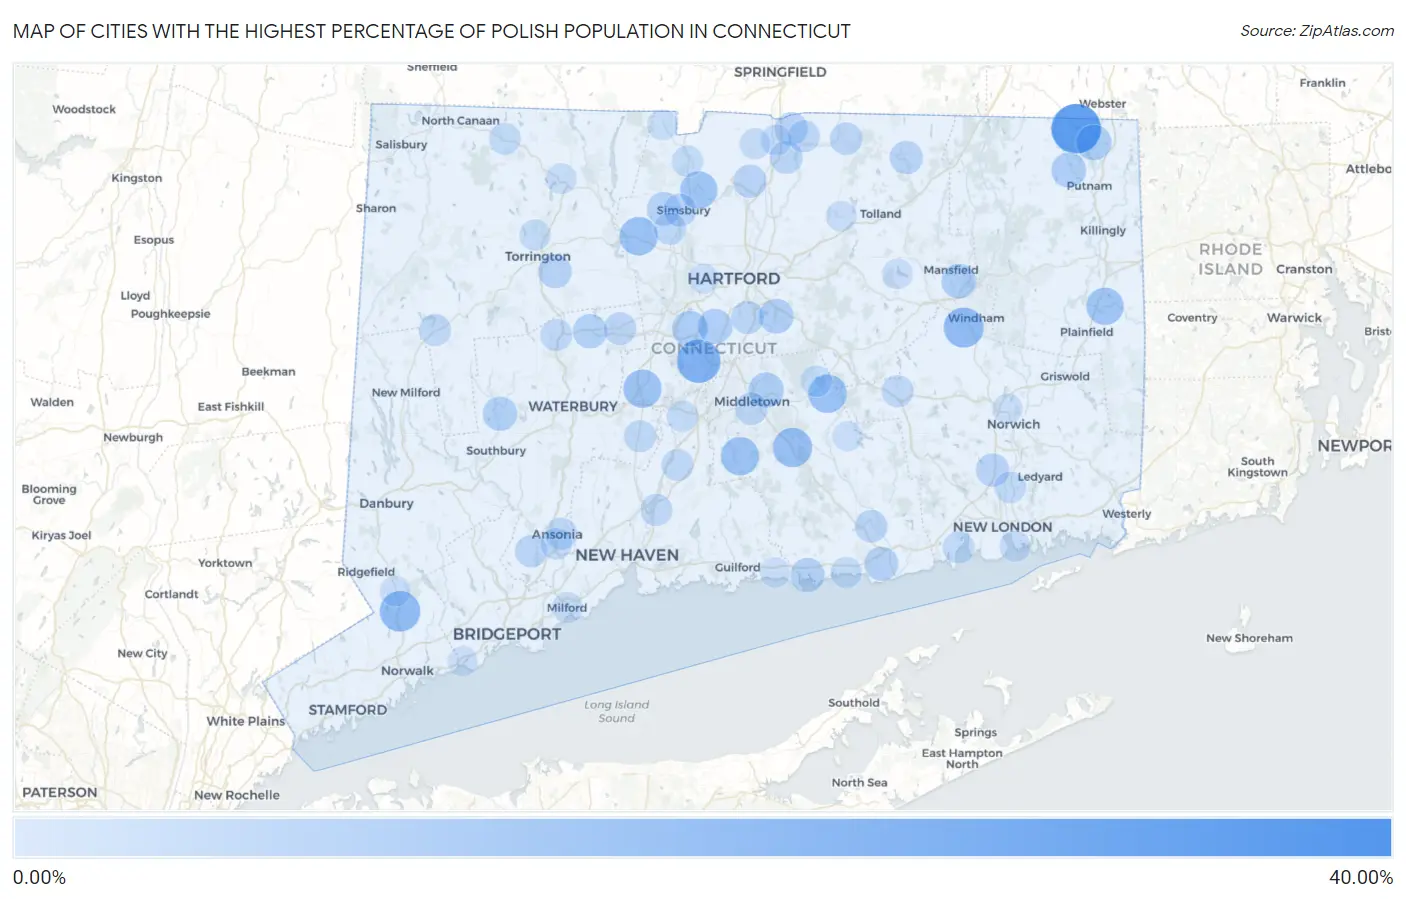
Map of Cities with the Highest Percentage of Polish Population in Connecticut
0.00%
40.00%
Cities with the Highest Percentage of Polish Population in Connecticut
| City | Polish | vs State | vs National | |
| 1. | Topstone | 37.64% | 6.44%(+31.2)#1 | 2.61%(+35.0)#58 |
| 2. | Quinebaug | 33.19% | 6.44%(+26.7)#2 | 2.61%(+30.6)#87 |
| 3. | Kensington | 24.45% | 6.44%(+18.0)#3 | 2.61%(+21.8)#211 |
| 4. | West Mountain | 22.70% | 6.44%(+16.3)#4 | 2.61%(+20.1)#261 |
| 5. | Cannondale | 20.30% | 6.44%(+13.9)#5 | 2.61%(+17.7)#330 |
| 6. | South Windham | 19.55% | 6.44%(+13.1)#6 | 2.61%(+16.9)#366 |
| 7. | Higganum | 18.37% | 6.44%(+11.9)#7 | 2.61%(+15.8)#420 |
| 8. | East Hampton | 17.39% | 6.44%(+10.9)#8 | 2.61%(+14.8)#476 |
| 9. | Canton Valley | 17.25% | 6.44%(+10.8)#9 | 2.61%(+14.6)#489 |
| 10. | Pleasant Valley | 16.94% | 6.44%(+10.5)#10 | 2.61%(+14.3)#519 |
| 11. | Durham | 16.92% | 6.44%(+10.5)#11 | 2.61%(+14.3)#522 |
| 12. | Plantsville | 16.79% | 6.44%(+10.4)#12 | 2.61%(+14.2)#530 |
| 13. | Tariffville | 15.64% | 6.44%(+9.20)#13 | 2.61%(+13.0)#631 |
| 14. | Moosup | 15.62% | 6.44%(+9.18)#14 | 2.61%(+13.0)#634 |
| 15. | Botsford | 14.01% | 6.44%(+7.57)#15 | 2.61%(+11.4)#831 |
| 16. | New Britain | 13.23% | 6.44%(+6.79)#16 | 2.61%(+10.6)#931 |
| 17. | North Grosvenor Dale | 12.96% | 6.44%(+6.52)#17 | 2.61%(+10.3)#970 |
| 18. | Portland | 12.58% | 6.44%(+6.13)#18 | 2.61%(+9.96)#1,030 |
| 19. | South Woodstock | 12.20% | 6.44%(+5.76)#19 | 2.61%(+9.59)#1,111 |
| 20. | Newington | 12.18% | 6.44%(+5.74)#20 | 2.61%(+9.57)#1,115 |
| 21. | Mansfield Center | 12.02% | 6.44%(+5.58)#21 | 2.61%(+9.41)#1,153 |
| 22. | Glastonbury Center | 11.97% | 6.44%(+5.53)#22 | 2.61%(+9.36)#1,167 |
| 23. | Terryville | 11.50% | 6.44%(+5.06)#23 | 2.61%(+8.89)#1,263 |
| 24. | Woodbury Center | 11.49% | 6.44%(+5.04)#24 | 2.61%(+8.88)#1,269 |
| 25. | Lakes West | 11.41% | 6.44%(+4.97)#25 | 2.61%(+8.80)#1,290 |
| 26. | Lake Chaffee | 11.30% | 6.44%(+4.85)#26 | 2.61%(+8.68)#1,317 |
| 27. | Clinton | 11.24% | 6.44%(+4.80)#27 | 2.61%(+8.63)#1,331 |
| 28. | Old Saybrook Center | 10.96% | 6.44%(+4.51)#28 | 2.61%(+8.35)#1,400 |
| 29. | Stepney | 10.83% | 6.44%(+4.39)#29 | 2.61%(+8.22)#1,431 |
| 30. | West Simsbury | 10.66% | 6.44%(+4.21)#30 | 2.61%(+8.05)#1,476 |
| 31. | Northwest Harwinton | 10.56% | 6.44%(+4.11)#31 | 2.61%(+7.94)#1,506 |
| 32. | Jewett City Borough | 10.45% | 6.44%(+4.01)#32 | 2.61%(+7.84)#1,531 |
| 33. | Tashua | 10.14% | 6.44%(+3.69)#33 | 2.61%(+7.52)#1,623 |
| 34. | Windsor Locks | 10.12% | 6.44%(+3.68)#34 | 2.61%(+7.51)#1,628 |
| 35. | Sherwood Manor | 10.02% | 6.44%(+3.57)#35 | 2.61%(+7.40)#1,661 |
| 36. | Stafford Springs | 9.98% | 6.44%(+3.54)#36 | 2.61%(+7.37)#1,669 |
| 37. | Oxoboxo River | 9.92% | 6.44%(+3.48)#37 | 2.61%(+7.31)#1,686 |
| 38. | Knollcrest | 9.60% | 6.44%(+3.16)#38 | 2.61%(+6.99)#1,797 |
| 39. | Wethersfield | 9.56% | 6.44%(+3.12)#39 | 2.61%(+6.95)#1,820 |
| 40. | Quasset Lake | 9.43% | 6.44%(+2.98)#40 | 2.61%(+6.81)#1,863 |
| 41. | Mamanasco Lake | 9.36% | 6.44%(+2.92)#41 | 2.61%(+6.75)#1,888 |
| 42. | Simsbury Center | 9.30% | 6.44%(+2.85)#42 | 2.61%(+6.68)#1,904 |
| 43. | Southwood Acres | 9.28% | 6.44%(+2.84)#43 | 2.61%(+6.67)#1,907 |
| 44. | Somers | 9.14% | 6.44%(+2.70)#44 | 2.61%(+6.53)#1,953 |
| 45. | Essex Village | 9.10% | 6.44%(+2.66)#45 | 2.61%(+6.49)#1,969 |
| 46. | Bristol | 9.07% | 6.44%(+2.63)#46 | 2.61%(+6.46)#1,981 |
| 47. | Middletown | 8.98% | 6.44%(+2.53)#47 | 2.61%(+6.37)#2,012 |
| 48. | Shelton | 8.86% | 6.44%(+2.42)#48 | 2.61%(+6.25)#2,050 |
| 49. | Hazardville | 8.56% | 6.44%(+2.11)#49 | 2.61%(+5.95)#2,183 |
| 50. | Ansonia | 8.52% | 6.44%(+2.08)#50 | 2.61%(+5.91)#2,207 |
| 51. | Colchester | 8.48% | 6.44%(+2.04)#51 | 2.61%(+5.87)#2,230 |
| 52. | Weatogue | 8.46% | 6.44%(+2.02)#52 | 2.61%(+5.85)#2,242 |
| 53. | New Preston | 8.38% | 6.44%(+1.94)#53 | 2.61%(+5.77)#2,278 |
| 54. | Trumbull Center | 8.37% | 6.44%(+1.93)#54 | 2.61%(+5.76)#2,288 |
| 55. | Cheshire Village | 8.37% | 6.44%(+1.93)#55 | 2.61%(+5.76)#2,289 |
| 56. | North Haven | 8.35% | 6.44%(+1.91)#56 | 2.61%(+5.74)#2,301 |
| 57. | Wallingford Center | 8.35% | 6.44%(+1.90)#57 | 2.61%(+5.74)#2,303 |
| 58. | Thomaston | 8.19% | 6.44%(+1.75)#58 | 2.61%(+5.58)#2,375 |
| 59. | Niantic | 8.09% | 6.44%(+1.65)#59 | 2.61%(+5.48)#2,423 |
| 60. | Darien Downtown | 8.07% | 6.44%(+1.63)#60 | 2.61%(+5.46)#2,434 |
| 61. | Norfolk | 7.98% | 6.44%(+1.53)#61 | 2.61%(+5.36)#2,479 |
| 62. | Derby | 7.86% | 6.44%(+1.42)#62 | 2.61%(+5.25)#2,525 |
| 63. | Gales Ferry | 7.64% | 6.44%(+1.19)#63 | 2.61%(+5.03)#2,627 |
| 64. | Northford | 7.61% | 6.44%(+1.17)#64 | 2.61%(+5.00)#2,638 |
| 65. | Meriden | 7.51% | 6.44%(+1.07)#65 | 2.61%(+4.90)#2,695 |
| 66. | Staples | 7.50% | 6.44%(+1.06)#66 | 2.61%(+4.89)#2,703 |
| 67. | Lake Pocotopaug | 7.48% | 6.44%(+1.03)#67 | 2.61%(+4.87)#2,717 |
| 68. | Salmon Brook | 7.37% | 6.44%(+0.928)#68 | 2.61%(+4.76)#2,797 |
| 69. | Torrington | 7.25% | 6.44%(+0.811)#69 | 2.61%(+4.64)#2,880 |
| 70. | Taylor Corners | 7.24% | 6.44%(+0.800)#70 | 2.61%(+4.63)#2,888 |
| 71. | East | 7.23% | 6.44%(+0.790)#71 | 2.61%(+4.62)#2,893 |
| 72. | Cornwall | 7.23% | 6.44%(+0.785)#72 | 2.61%(+4.62)#2,898 |
| 73. | Westbrook Center | 7.16% | 6.44%(+0.721)#73 | 2.61%(+4.55)#2,938 |
| 74. | Thompsonville | 7.03% | 6.44%(+0.584)#74 | 2.61%(+4.42)#3,026 |
| 75. | Westport | 7.01% | 6.44%(+0.565)#75 | 2.61%(+4.40)#3,038 |
| 76. | Milford City Balance | 6.98% | 6.44%(+0.536)#76 | 2.61%(+4.37)#3,055 |
| 77. | Suffield Depot | 6.95% | 6.44%(+0.502)#77 | 2.61%(+4.33)#3,076 |
| 78. | Mill Plain | 6.84% | 6.44%(+0.401)#78 | 2.61%(+4.23)#3,144 |
| 79. | Groton | 6.73% | 6.44%(+0.284)#79 | 2.61%(+4.12)#3,214 |
| 80. | South Wilton | 6.65% | 6.44%(+0.209)#80 | 2.61%(+4.04)#3,261 |
| 81. | Daniels Farm | 6.61% | 6.44%(+0.166)#81 | 2.61%(+4.00)#3,294 |
| 82. | Naugatuck Borough | 6.61% | 6.44%(+0.166)#82 | 2.61%(+4.00)#3,295 |
| 83. | Winsted | 6.57% | 6.44%(+0.126)#83 | 2.61%(+3.96)#3,323 |
| 84. | Rockville | 6.50% | 6.44%(+0.059)#84 | 2.61%(+3.89)#3,374 |
| 85. | Litchfield Borough | 6.42% | 6.44%(-0.023)#85 | 2.61%(+3.81)#3,431 |
| 86. | North Granby | 6.36% | 6.44%(-0.081)#86 | 2.61%(+3.75)#3,474 |
| 87. | Woodmont Borough | 6.36% | 6.44%(-0.082)#87 | 2.61%(+3.75)#3,475 |
| 88. | Bridgewater | 6.34% | 6.44%(-0.106)#88 | 2.61%(+3.73)#3,487 |
| 89. | Coleytown | 6.31% | 6.44%(-0.131)#89 | 2.61%(+3.70)#3,511 |
| 90. | Georgetown | 6.28% | 6.44%(-0.163)#90 | 2.61%(+3.67)#3,537 |
| 91. | Coventry Lake | 6.23% | 6.44%(-0.210)#91 | 2.61%(+3.62)#3,566 |
| 92. | Norwich | 6.00% | 6.44%(-0.444)#92 | 2.61%(+3.39)#3,773 |
| 93. | Madison Center | 5.99% | 6.44%(-0.454)#93 | 2.61%(+3.38)#3,779 |
| 94. | Newtown Borough | 5.97% | 6.44%(-0.471)#94 | 2.61%(+3.36)#3,791 |
| 95. | Moodus | 5.94% | 6.44%(-0.501)#95 | 2.61%(+3.33)#3,811 |
| 96. | Inglenook | 5.91% | 6.44%(-0.529)#96 | 2.61%(+3.30)#3,840 |
| 97. | Candlewood Knolls | 5.88% | 6.44%(-0.561)#97 | 2.61%(+3.27)#3,868 |
| 98. | Groton Long Point Borough | 5.80% | 6.44%(-0.641)#98 | 2.61%(+3.19)#3,937 |
| 99. | West Hartford | 5.76% | 6.44%(-0.683)#99 | 2.61%(+3.15)#3,984 |
| 100. | Southport | 5.74% | 6.44%(-0.701)#100 | 2.61%(+3.13)#4,003 |
Common Questions
What are the Top 10 Cities with the Highest Percentage of Polish Population in Connecticut?
Top 10 Cities with the Highest Percentage of Polish Population in Connecticut are:
#1
33.19%
#2
24.45%
#3
20.30%
#4
19.55%
#5
18.37%
#6
17.39%
#7
17.25%
#8
16.92%
#9
16.79%
#10
15.64%
What city has the Highest Percentage of Polish Population in Connecticut?
Quinebaug has the Highest Percentage of Polish Population in Connecticut with 33.19%.
What is the Percentage of Polish Population in the State of Connecticut?
Percentage of Polish Population in Connecticut is 6.44%.
What is the Percentage of Polish Population in the United States?
Percentage of Polish Population in the United States is 2.61%.