Cities with the Highest Percentage of Immigrants from Iran in Virginia
RELATED REPORTS & OPTIONS
Iran
Virginia
Compare Cities
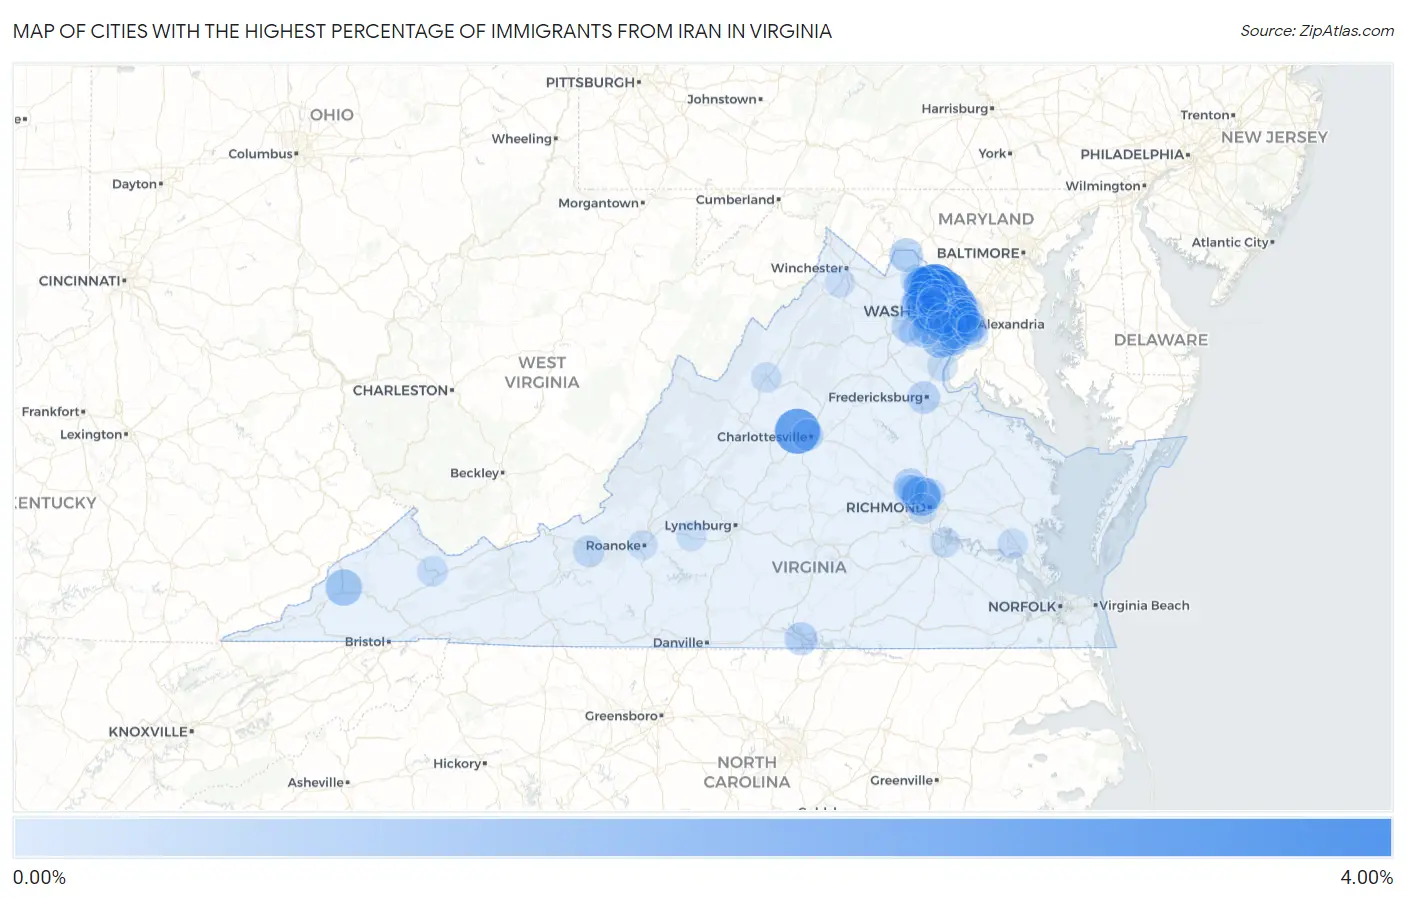
Map of Cities with the Highest Percentage of Immigrants from Iran in Virginia
0.00%
4.00%
Cities with the Highest Percentage of Immigrants from Iran in Virginia
| City | Iran | vs State | vs National | |
| 1. | Cascades | 3.97% | 0.17%(+3.80)#46 | 0.12%(+3.85)#641 |
| 2. | Tysons | 3.43% | 0.17%(+3.26)#47 | 0.12%(+3.31)#642 |
| 3. | Great Falls | 3.23% | 0.17%(+3.07)#48 | 0.12%(+3.12)#643 |
| 4. | Countryside | 3.13% | 0.17%(+2.96)#92 | 0.12%(+3.01)#1,583 |
| 5. | Ivy | 3.08% | 0.17%(+2.91)#93 | 0.12%(+2.96)#1,584 |
| 6. | Idylwood | 2.28% | 0.17%(+2.12)#94 | 0.12%(+2.16)#1,585 |
| 7. | Lowes Island | 2.27% | 0.17%(+2.11)#95 | 0.12%(+2.15)#1,586 |
| 8. | Dulles Town Center | 2.01% | 0.17%(+1.84)#96 | 0.12%(+1.89)#1,587 |
| 9. | Dumbarton | 1.86% | 0.17%(+1.69)#183 | 0.12%(+1.74)#4,614 |
| 10. | Fair Lakes | 1.63% | 0.17%(+1.46)#184 | 0.12%(+1.51)#4,615 |
| 11. | Belmont | 1.57% | 0.17%(+1.40)#185 | 0.12%(+1.45)#4,616 |
| 12. | Wolf Trap | 1.57% | 0.17%(+1.40)#186 | 0.12%(+1.45)#4,617 |
| 13. | Vienna | 1.53% | 0.17%(+1.36)#187 | 0.12%(+1.41)#4,618 |
| 14. | Merrifield | 1.47% | 0.17%(+1.30)#188 | 0.12%(+1.35)#4,619 |
| 15. | Chantilly | 1.30% | 0.17%(+1.14)#189 | 0.12%(+1.18)#4,620 |
| 16. | Mclean | 1.30% | 0.17%(+1.13)#190 | 0.12%(+1.18)#4,621 |
| 17. | Wise | 1.28% | 0.17%(+1.12)#191 | 0.12%(+1.16)#4,622 |
| 18. | County Center | 1.24% | 0.17%(+1.08)#192 | 0.12%(+1.12)#4,623 |
| 19. | Great Falls Crossing | 1.23% | 0.17%(+1.06)#193 | 0.12%(+1.11)#4,624 |
| 20. | Lake Barcroft | 1.21% | 0.17%(+1.04)#194 | 0.12%(+1.09)#4,625 |
| 21. | Difficult Run | 1.03% | 0.17%(+0.858)#195 | 0.12%(+0.907)#4,626 |
| 22. | Lansdowne | 0.99% | 0.17%(+0.822)#196 | 0.12%(+0.871)#4,627 |
| 23. | Fair Oaks | 0.86% | 0.17%(+0.695)#197 | 0.12%(+0.744)#4,628 |
| 24. | Reston | 0.86% | 0.17%(+0.691)#198 | 0.12%(+0.740)#4,629 |
| 25. | Sugarland Run | 0.86% | 0.17%(+0.691)#199 | 0.12%(+0.740)#4,630 |
| 26. | Lovettsville | 0.75% | 0.17%(+0.583)#200 | 0.12%(+0.632)#4,631 |
| 27. | Franconia | 0.75% | 0.17%(+0.581)#201 | 0.12%(+0.630)#4,632 |
| 28. | Braddock | 0.74% | 0.17%(+0.572)#202 | 0.12%(+0.621)#4,633 |
| 29. | Dunn Loring | 0.72% | 0.17%(+0.556)#203 | 0.12%(+0.605)#4,634 |
| 30. | Union Mill | 0.72% | 0.17%(+0.553)#204 | 0.12%(+0.602)#4,635 |
| 31. | Woodburn | 0.71% | 0.17%(+0.546)#205 | 0.12%(+0.595)#4,636 |
| 32. | Ashburn | 0.69% | 0.17%(+0.521)#206 | 0.12%(+0.570)#4,637 |
| 33. | Laurel Hill | 0.67% | 0.17%(+0.501)#207 | 0.12%(+0.550)#4,638 |
| 34. | Franklin Farm | 0.65% | 0.17%(+0.484)#208 | 0.12%(+0.532)#4,639 |
| 35. | Kings Park | 0.65% | 0.17%(+0.482)#209 | 0.12%(+0.531)#4,640 |
| 36. | Wyndham | 0.64% | 0.17%(+0.477)#210 | 0.12%(+0.526)#4,641 |
| 37. | Clarksville | 0.61% | 0.17%(+0.447)#211 | 0.12%(+0.496)#4,642 |
| 38. | Arcola | 0.57% | 0.17%(+0.407)#212 | 0.12%(+0.456)#4,643 |
| 39. | Kings Park West | 0.56% | 0.17%(+0.391)#213 | 0.12%(+0.440)#4,644 |
| 40. | Stone Ridge | 0.55% | 0.17%(+0.387)#214 | 0.12%(+0.436)#4,645 |
| 41. | Annandale | 0.55% | 0.17%(+0.381)#215 | 0.12%(+0.430)#4,646 |
| 42. | Oakton | 0.54% | 0.17%(+0.378)#216 | 0.12%(+0.427)#4,647 |
| 43. | Dranesville | 0.53% | 0.17%(+0.368)#217 | 0.12%(+0.417)#4,648 |
| 44. | Fredericksburg | 0.53% | 0.17%(+0.360)#218 | 0.12%(+0.409)#4,649 |
| 45. | Pimmit Hills | 0.52% | 0.17%(+0.356)#219 | 0.12%(+0.405)#4,650 |
| 46. | Lincolnia | 0.51% | 0.17%(+0.348)#220 | 0.12%(+0.397)#4,651 |
| 47. | Brambleton | 0.51% | 0.17%(+0.342)#221 | 0.12%(+0.391)#4,652 |
| 48. | Falls Church | 0.51% | 0.17%(+0.341)#222 | 0.12%(+0.389)#4,653 |
| 49. | Loudoun Valley Estates | 0.49% | 0.17%(+0.327)#223 | 0.12%(+0.376)#4,654 |
| 50. | South Riding | 0.49% | 0.17%(+0.324)#224 | 0.12%(+0.373)#4,655 |
| 51. | West Falls Church | 0.49% | 0.17%(+0.318)#225 | 0.12%(+0.367)#4,656 |
| 52. | Gainesville | 0.48% | 0.17%(+0.316)#226 | 0.12%(+0.365)#4,657 |
| 53. | Fairfax | 0.44% | 0.17%(+0.274)#227 | 0.12%(+0.323)#4,658 |
| 54. | Hutchison | 0.42% | 0.17%(+0.250)#228 | 0.12%(+0.299)#4,659 |
| 55. | Fort Hunt | 0.41% | 0.17%(+0.239)#229 | 0.12%(+0.288)#4,660 |
| 56. | Burke Centre | 0.38% | 0.17%(+0.218)#230 | 0.12%(+0.267)#4,661 |
| 57. | University Of Virginia | 0.38% | 0.17%(+0.216)#231 | 0.12%(+0.265)#4,662 |
| 58. | Arlington | 0.38% | 0.17%(+0.214)#232 | 0.12%(+0.263)#4,663 |
| 59. | Centreville | 0.36% | 0.17%(+0.192)#233 | 0.12%(+0.241)#4,664 |
| 60. | Blacksburg | 0.33% | 0.17%(+0.167)#234 | 0.12%(+0.216)#4,665 |
| 61. | Floris | 0.32% | 0.17%(+0.156)#235 | 0.12%(+0.205)#4,666 |
| 62. | Linton Hall | 0.28% | 0.17%(+0.116)#236 | 0.12%(+0.165)#4,667 |
| 63. | Burke | 0.28% | 0.17%(+0.113)#237 | 0.12%(+0.162)#4,668 |
| 64. | Leesburg | 0.28% | 0.17%(+0.109)#238 | 0.12%(+0.158)#4,669 |
| 65. | Seven Corners | 0.27% | 0.17%(+0.106)#239 | 0.12%(+0.155)#4,670 |
| 66. | Lake Ridge | 0.26% | 0.17%(+0.092)#240 | 0.12%(+0.141)#4,671 |
| 67. | Lakeside | 0.25% | 0.17%(+0.080)#241 | 0.12%(+0.129)#4,692 |
| 68. | Short Pump | 0.24% | 0.17%(+0.076)#242 | 0.12%(+0.125)#4,693 |
| 69. | Chamberlayne | 0.24% | 0.17%(+0.075)#243 | 0.12%(+0.123)#4,694 |
| 70. | Lorton | 0.23% | 0.17%(+0.060)#244 | 0.12%(+0.109)#4,695 |
| 71. | Newington | 0.20% | 0.17%(+0.032)#245 | 0.12%(+0.081)#4,696 |
| 72. | Richlands | 0.19% | 0.17%(+0.023)#246 | 0.12%(+0.072)#4,697 |
| 73. | North Springfield | 0.19% | 0.17%(+0.021)#247 | 0.12%(+0.070)#4,984 |
| 74. | Manassas | 0.19% | 0.17%(+0.021)#248 | 0.12%(+0.070)#4,985 |
| 75. | Newington Forest | 0.18% | 0.17%(+0.015)#249 | 0.12%(+0.064)#4,986 |
| 76. | Long Branch | 0.17% | 0.17%(+0.003)#250 | 0.12%(+0.052)#4,987 |
| 77. | Alexandria | 0.17% | 0.17%(+0.002)#251 | 0.12%(+0.051)#4,988 |
| 78. | Manassas Park | 0.17% | 0.17%(+0.002)#252 | 0.12%(+0.051)#4,989 |
| 79. | Greenbriar | 0.16% | 0.17%(-0.004)#253 | 0.12%(+0.045)#4,990 |
| 80. | Williamsburg | 0.16% | 0.17%(-0.006)#254 | 0.12%(+0.043)#4,991 |
| 81. | Herndon | 0.16% | 0.17%(-0.008)#255 | 0.12%(+0.041)#4,992 |
| 82. | Sterling | 0.15% | 0.17%(-0.016)#256 | 0.12%(+0.033)#4,993 |
| 83. | Huntington | 0.15% | 0.17%(-0.016)#257 | 0.12%(+0.033)#4,994 |
| 84. | Innsbrook | 0.15% | 0.17%(-0.018)#258 | 0.12%(+0.031)#4,995 |
| 85. | Quantico Base | 0.15% | 0.17%(-0.018)#259 | 0.12%(+0.031)#4,996 |
| 86. | Woodlawn Cdp Fairfax County | 0.15% | 0.17%(-0.019)#260 | 0.12%(+0.030)#4,997 |
| 87. | Belle Haven | 0.14% | 0.17%(-0.026)#261 | 0.12%(+0.023)#4,998 |
| 88. | Mcnair | 0.13% | 0.17%(-0.036)#262 | 0.12%(+0.013)#4,999 |
| 89. | Harrisonburg | 0.12% | 0.17%(-0.044)#263 | 0.12%(+0.005)#5,000 |
| 90. | Richmond | 0.11% | 0.17%(-0.061)#264 | 0.12%(-0.012)#5,001 |
| 91. | Hopewell | 0.10% | 0.17%(-0.063)#265 | 0.12%(-0.014)#5,002 |
| 92. | Rose Hill Cdp Fairfax County | 0.10% | 0.17%(-0.063)#266 | 0.12%(-0.014)#5,447 |
| 93. | Groveton | 0.10% | 0.17%(-0.065)#267 | 0.12%(-0.016)#5,448 |
| 94. | George Mason | 0.100% | 0.17%(-0.067)#268 | 0.12%(-0.018)#5,449 |
| 95. | Stephens City | 0.095% | 0.17%(-0.072)#269 | 0.12%(-0.023)#5,450 |
| 96. | Fairfax Station | 0.090% | 0.17%(-0.078)#270 | 0.12%(-0.029)#5,451 |
| 97. | Roanoke | 0.072% | 0.17%(-0.096)#271 | 0.12%(-0.047)#5,452 |
| 98. | Bailey S Crossroads | 0.069% | 0.17%(-0.099)#272 | 0.12%(-0.050)#5,453 |
| 99. | Leesylvania | 0.068% | 0.17%(-0.099)#273 | 0.12%(-0.050)#5,454 |
| 100. | Bedford | 0.060% | 0.17%(-0.107)#274 | 0.12%(-0.058)#5,455 |
Common Questions
What are the Top 10 Cities with the Highest Percentage of Immigrants from Iran in Virginia?
Top 10 Cities with the Highest Percentage of Immigrants from Iran in Virginia are:
#1
3.97%
#2
3.43%
#3
3.23%
#4
3.13%
#5
3.08%
#6
2.28%
#7
2.27%
#8
2.01%
#9
1.86%
#10
1.63%
What city has the Highest Percentage of Immigrants from Iran in Virginia?
Cascades has the Highest Percentage of Immigrants from Iran in Virginia with 3.97%.
What is the Percentage of Immigrants from Iran in the State of Virginia?
Percentage of Immigrants from Iran in Virginia is 0.17%.
What is the Percentage of Immigrants from Iran in the United States?
Percentage of Immigrants from Iran in the United States is 0.12%.