Zip Codes with the Highest Percentage of Households With One or more Vehicles in Port Angeles, WA
RELATED REPORTS & OPTIONS
Households with 1 or more Cars
Port Angeles
Compare Zip Codes
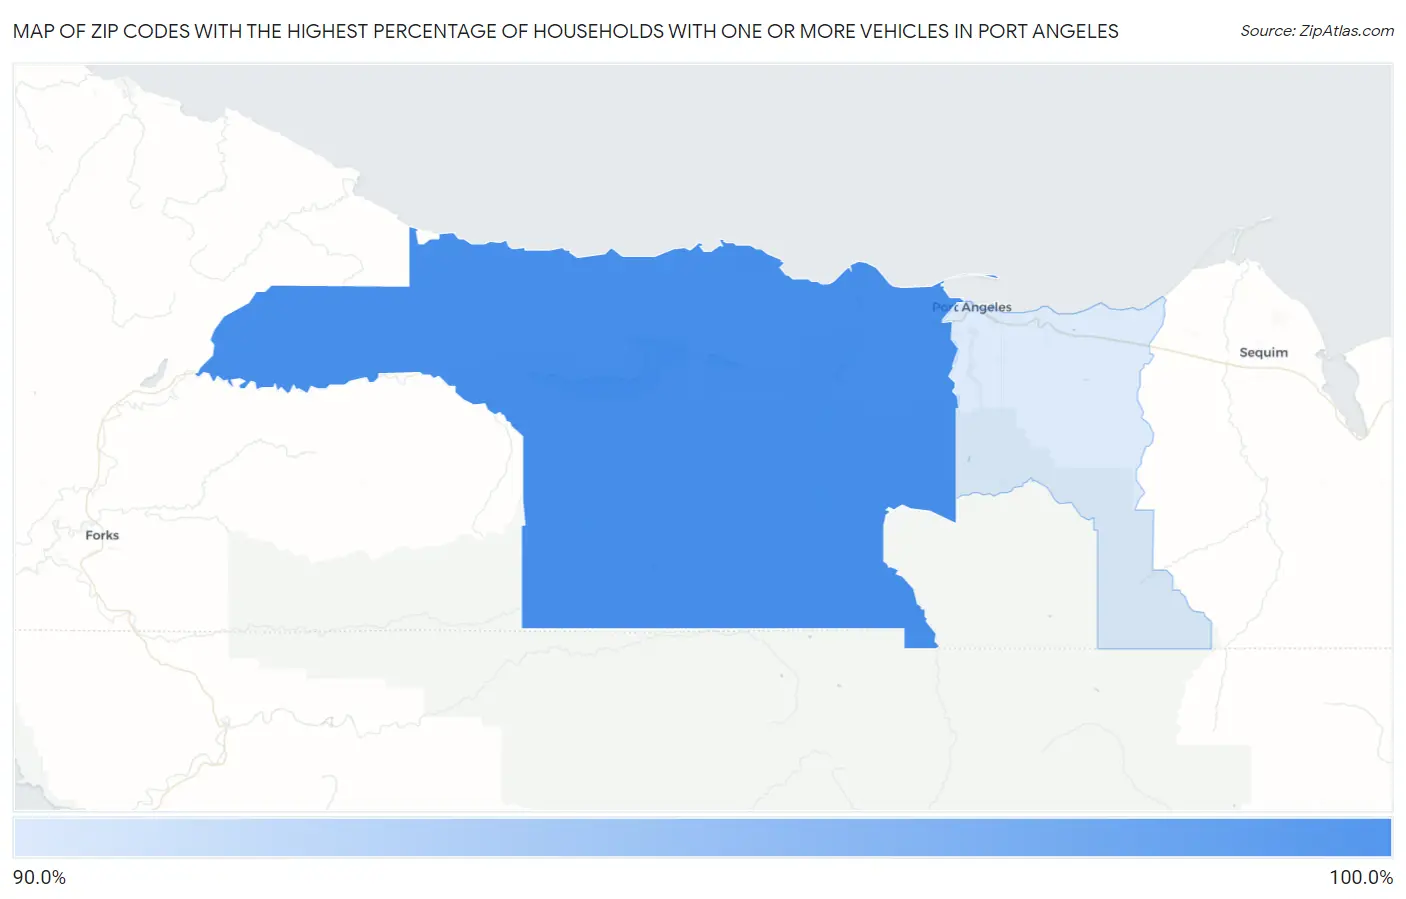
Map of Zip Codes with the Highest Percentage of Households With One or more Vehicles in Port Angeles
90.9%
96.2%
Zip Codes with the Highest Percentage of Households With One or more Vehicles in Port Angeles, WA
| Zip Code | Housholds With 1+ Cars | vs State | vs National | |
| 1. | 98363 | 96.2% | 93.2%(+3.00)#323 | 91.7%(+4.50)#16,316 |
| 2. | 98362 | 90.9% | 93.2%(-2.30)#513 | 91.7%(-0.800)#27,124 |
1
Common Questions
What are the Top Zip Codes with the Highest Percentage of Households With One or more Vehicles in Port Angeles, WA?
Top Zip Codes with the Highest Percentage of Households With One or more Vehicles in Port Angeles, WA are:
What zip code has the Highest Percentage of Households With One or more Vehicles in Port Angeles, WA?
98363 has the Highest Percentage of Households With One or more Vehicles in Port Angeles, WA with 96.2%.
What is the Percentage of Households With One or more Vehicles in Port Angeles, WA?
Percentage of Households With One or more Vehicles in Port Angeles is 90.0%.
What is the Percentage of Households With One or more Vehicles in Washington?
Percentage of Households With One or more Vehicles in Washington is 93.2%.
What is the Percentage of Households With One or more Vehicles in the United States?
Percentage of Households With One or more Vehicles in the United States is 91.7%.