Cities with the Most Immigrants from Ghana in Ohio
RELATED REPORTS & OPTIONS
Ghana
Ohio
Compare Cities
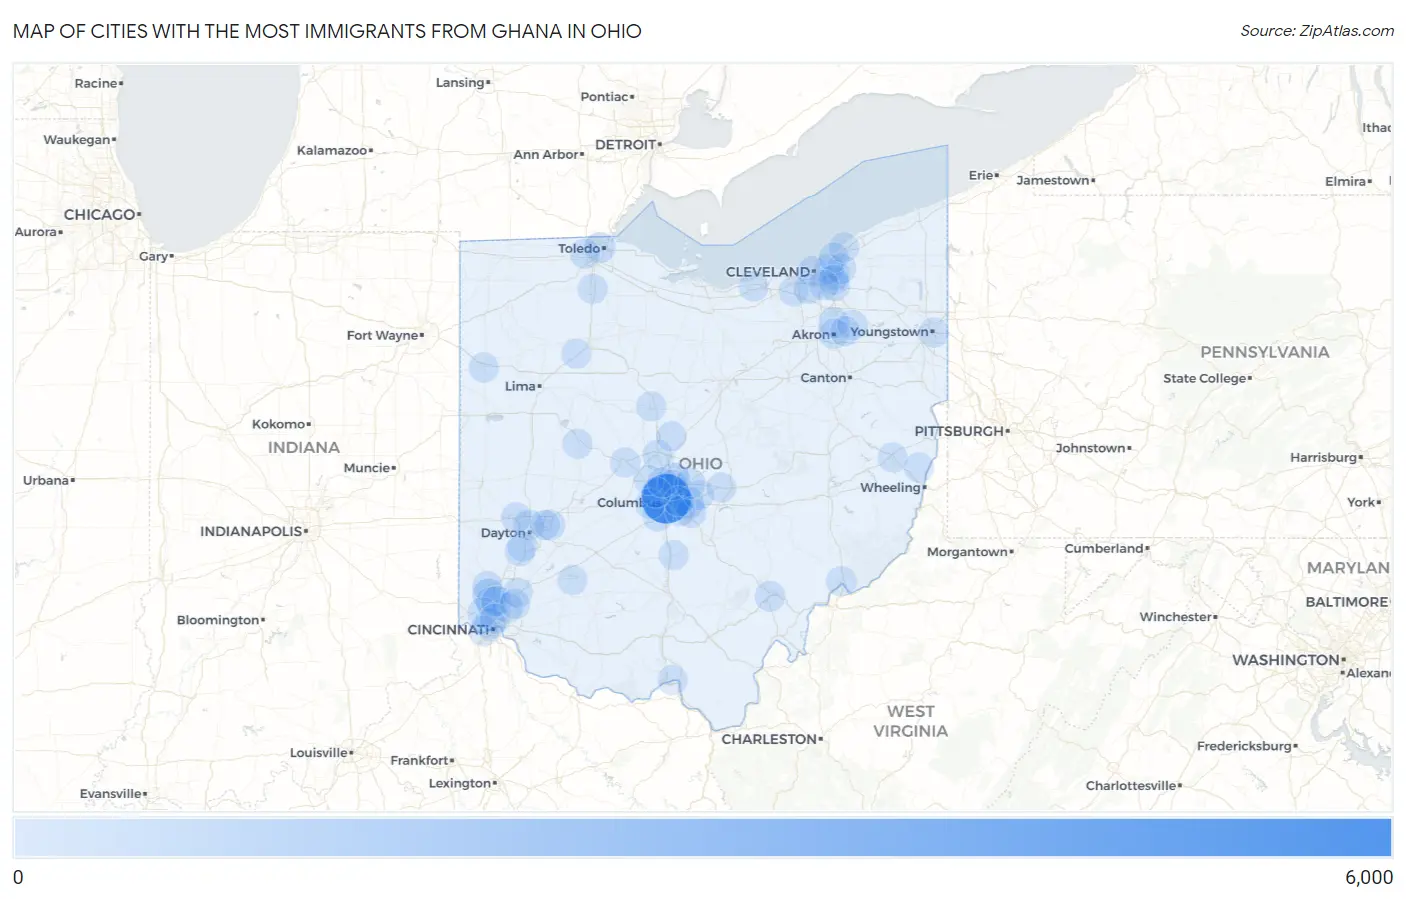
Map of Cities with the Most Immigrants from Ghana in Ohio
0
6,000
Cities with the Most Immigrants from Ghana in Ohio
| City | Ghana | vs State | vs National | |
| 1. | Columbus | 5,771 | 10,561(54.64%)#1 | 201,796(2.86%)#3 |
| 2. | Fairfield | 704 | 10,561(6.67%)#2 | 201,796(0.35%)#29 |
| 3. | Westerville | 453 | 10,561(4.29%)#3 | 201,796(0.22%)#58 |
| 4. | Reynoldsburg | 260 | 10,561(2.46%)#4 | 201,796(0.13%)#99 |
| 5. | Forest Park | 241 | 10,561(2.28%)#5 | 201,796(0.12%)#111 |
| 6. | Cincinnati | 231 | 10,561(2.19%)#6 | 201,796(0.11%)#122 |
| 7. | Cuyahoga Falls | 154 | 10,561(1.46%)#7 | 201,796(0.08%)#203 |
| 8. | Toledo | 150 | 10,561(1.42%)#8 | 201,796(0.07%)#208 |
| 9. | Athens | 139 | 10,561(1.32%)#9 | 201,796(0.07%)#225 |
| 10. | Akron | 111 | 10,561(1.05%)#10 | 201,796(0.06%)#286 |
| 11. | Dayton | 111 | 10,561(1.05%)#11 | 201,796(0.06%)#287 |
| 12. | Cleveland | 109 | 10,561(1.03%)#12 | 201,796(0.05%)#290 |
| 13. | Delaware | 104 | 10,561(0.98%)#13 | 201,796(0.05%)#305 |
| 14. | Blue Ash | 88 | 10,561(0.83%)#14 | 201,796(0.04%)#360 |
| 15. | Hamilton | 85 | 10,561(0.80%)#15 | 201,796(0.04%)#368 |
| 16. | Fairborn | 77 | 10,561(0.73%)#16 | 201,796(0.04%)#403 |
| 17. | Minerva Park | 74 | 10,561(0.70%)#17 | 201,796(0.04%)#415 |
| 18. | Pickerington | 63 | 10,561(0.60%)#18 | 201,796(0.03%)#482 |
| 19. | Grove City | 61 | 10,561(0.58%)#19 | 201,796(0.03%)#499 |
| 20. | Englewood | 55 | 10,561(0.52%)#20 | 201,796(0.03%)#542 |
| 21. | Parma | 54 | 10,561(0.51%)#21 | 201,796(0.03%)#545 |
| 22. | Bedford Heights | 44 | 10,561(0.42%)#22 | 201,796(0.02%)#616 |
| 23. | Marietta | 39 | 10,561(0.37%)#23 | 201,796(0.02%)#676 |
| 24. | Delshire | 39 | 10,561(0.37%)#24 | 201,796(0.02%)#680 |
| 25. | White Oak | 38 | 10,561(0.36%)#25 | 201,796(0.02%)#687 |
| 26. | Pataskala | 38 | 10,561(0.36%)#26 | 201,796(0.02%)#688 |
| 27. | Springdale | 37 | 10,561(0.35%)#27 | 201,796(0.02%)#696 |
| 28. | Blacklick Estates | 37 | 10,561(0.35%)#28 | 201,796(0.02%)#697 |
| 29. | Lincoln Village | 35 | 10,561(0.33%)#29 | 201,796(0.02%)#720 |
| 30. | Bowling Green | 34 | 10,561(0.32%)#30 | 201,796(0.02%)#730 |
| 31. | Beachwood | 32 | 10,561(0.30%)#31 | 201,796(0.02%)#770 |
| 32. | Kent | 30 | 10,561(0.28%)#32 | 201,796(0.01%)#793 |
| 33. | Cleveland Heights | 29 | 10,561(0.27%)#33 | 201,796(0.01%)#802 |
| 34. | Dublin | 24 | 10,561(0.23%)#34 | 201,796(0.01%)#876 |
| 35. | Whitehall | 21 | 10,561(0.20%)#35 | 201,796(0.01%)#927 |
| 36. | Bellefontaine | 20 | 10,561(0.19%)#36 | 201,796(0.01%)#948 |
| 37. | New Albany | 20 | 10,561(0.19%)#37 | 201,796(0.01%)#949 |
| 38. | Mayfield Heights | 19 | 10,561(0.18%)#38 | 201,796(0.01%)#964 |
| 39. | Wilmington | 18 | 10,561(0.17%)#39 | 201,796(0.01%)#986 |
| 40. | St Bernard | 17 | 10,561(0.16%)#40 | 201,796(0.01%)#1,018 |
| 41. | Euclid | 16 | 10,561(0.15%)#41 | 201,796(0.01%)#1,028 |
| 42. | Mason | 16 | 10,561(0.15%)#42 | 201,796(0.01%)#1,032 |
| 43. | Warrensville Heights | 16 | 10,561(0.15%)#43 | 201,796(0.01%)#1,039 |
| 44. | West Carrollton | 16 | 10,561(0.15%)#44 | 201,796(0.01%)#1,041 |
| 45. | Cadiz | 16 | 10,561(0.15%)#45 | 201,796(0.01%)#1,047 |
| 46. | Miamisburg | 15 | 10,561(0.14%)#46 | 201,796(0.01%)#1,061 |
| 47. | Portsmouth | 15 | 10,561(0.14%)#47 | 201,796(0.01%)#1,063 |
| 48. | Youngstown | 14 | 10,561(0.13%)#48 | 201,796(0.01%)#1,078 |
| 49. | Garfield Heights | 14 | 10,561(0.13%)#49 | 201,796(0.01%)#1,079 |
| 50. | Marysville | 14 | 10,561(0.13%)#50 | 201,796(0.01%)#1,081 |
| 51. | Amherst | 14 | 10,561(0.13%)#51 | 201,796(0.01%)#1,085 |
| 52. | Marion | 11 | 10,561(0.10%)#52 | 201,796(0.01%)#1,150 |
| 53. | Berea | 11 | 10,561(0.10%)#53 | 201,796(0.01%)#1,156 |
| 54. | Holland | 11 | 10,561(0.10%)#54 | 201,796(0.01%)#1,167 |
| 55. | Sixteen Mile Stand | 10 | 10,561(0.09%)#55 | 201,796(0.00%)#1,186 |
| 56. | Upper Arlington | 9 | 10,561(0.09%)#56 | 201,796(0.00%)#1,202 |
| 57. | Eastlake | 9 | 10,561(0.09%)#57 | 201,796(0.00%)#1,209 |
| 58. | Worthington | 9 | 10,561(0.09%)#58 | 201,796(0.00%)#1,211 |
| 59. | Granville | 9 | 10,561(0.09%)#59 | 201,796(0.00%)#1,215 |
| 60. | Tallmadge | 7 | 10,561(0.07%)#60 | 201,796(0.00%)#1,258 |
| 61. | Ashley | 7 | 10,561(0.07%)#61 | 201,796(0.00%)#1,271 |
| 62. | Rawson | 6 | 10,561(0.06%)#62 | 201,796(0.00%)#1,303 |
| 63. | Van Wert | 4 | 10,561(0.04%)#63 | 201,796(0.00%)#1,351 |
| 64. | Wright Patterson Afb | 3 | 10,561(0.03%)#64 | 201,796(0.00%)#1,382 |
| 65. | Circleville | 2 | 10,561(0.02%)#65 | 201,796(0.00%)#1,398 |
| 66. | Dillonvale | 2 | 10,561(0.02%)#66 | 201,796(0.00%)#1,411 |
Common Questions
What are the Top 10 Cities with the Most Immigrants from Ghana in Ohio?
Top 10 Cities with the Most Immigrants from Ghana in Ohio are:
#1
5,771
#2
704
#3
453
#4
260
#5
241
#6
231
#7
154
#8
150
#9
139
#10
111
What city has the Most Immigrants from Ghana in Ohio?
Columbus has the Most Immigrants from Ghana in Ohio with 5,771.
What is the Total Immigrants from Ghana in the State of Ohio?
Total Immigrants from Ghana in Ohio is 10,561.
What is the Total Immigrants from Ghana in the United States?
Total Immigrants from Ghana in the United States is 201,796.