Cities with the Most Immigrants from Ghana in Pennsylvania
RELATED REPORTS & OPTIONS
Ghana
Pennsylvania
Compare Cities
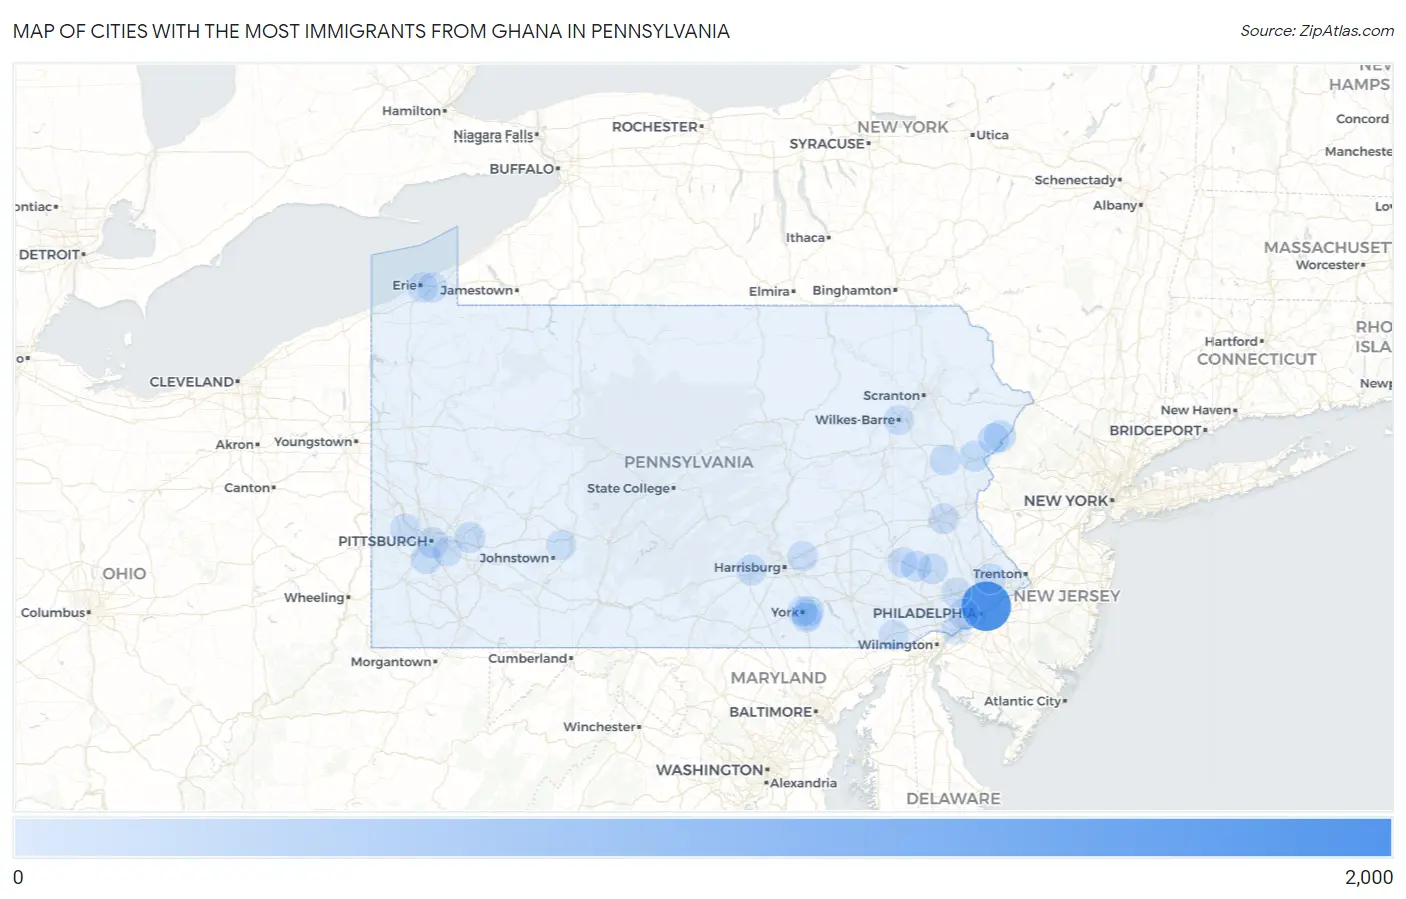
Map of Cities with the Most Immigrants from Ghana in Pennsylvania
0
2,000
Cities with the Most Immigrants from Ghana in Pennsylvania
| City | Ghana | vs State | vs National | |
| 1. | Philadelphia | 1,871 | 5,368(34.85%)#1 | 201,796(0.93%)#6 |
| 2. | Pine Ridge | 148 | 5,368(2.76%)#2 | 201,796(0.07%)#211 |
| 3. | Pittsburgh | 106 | 5,368(1.97%)#3 | 201,796(0.05%)#300 |
| 4. | Arlington Heights | 85 | 5,368(1.58%)#4 | 201,796(0.04%)#371 |
| 5. | Saw Creek | 83 | 5,368(1.55%)#5 | 201,796(0.04%)#380 |
| 6. | Sun Valley | 72 | 5,368(1.34%)#6 | 201,796(0.04%)#421 |
| 7. | Murrysville | 70 | 5,368(1.30%)#7 | 201,796(0.03%)#431 |
| 8. | Folcroft Borough | 69 | 5,368(1.29%)#8 | 201,796(0.03%)#444 |
| 9. | Pottstown Borough | 66 | 5,368(1.23%)#9 | 201,796(0.03%)#466 |
| 10. | Lansdowne Borough | 66 | 5,368(1.23%)#10 | 201,796(0.03%)#469 |
| 11. | Sanatoga | 65 | 5,368(1.21%)#11 | 201,796(0.03%)#475 |
| 12. | State College Borough | 59 | 5,368(1.10%)#12 | 201,796(0.03%)#508 |
| 13. | Amity Gardens | 58 | 5,368(1.08%)#13 | 201,796(0.03%)#517 |
| 14. | Warminster Heights | 58 | 5,368(1.08%)#14 | 201,796(0.03%)#518 |
| 15. | Sharon Hill Borough | 56 | 5,368(1.04%)#15 | 201,796(0.03%)#533 |
| 16. | Drexel Hill | 49 | 5,368(0.91%)#16 | 201,796(0.02%)#574 |
| 17. | Bethel Park | 48 | 5,368(0.89%)#17 | 201,796(0.02%)#585 |
| 18. | Schlusser | 47 | 5,368(0.88%)#18 | 201,796(0.02%)#595 |
| 19. | Queens Gate | 46 | 5,368(0.86%)#19 | 201,796(0.02%)#602 |
| 20. | Allentown | 45 | 5,368(0.84%)#20 | 201,796(0.02%)#606 |
| 21. | Swarthmore Borough | 40 | 5,368(0.75%)#21 | 201,796(0.02%)#665 |
| 22. | Skyline View | 39 | 5,368(0.73%)#22 | 201,796(0.02%)#679 |
| 23. | Elkins Park | 38 | 5,368(0.71%)#23 | 201,796(0.02%)#691 |
| 24. | Villanova | 32 | 5,368(0.60%)#24 | 201,796(0.02%)#771 |
| 25. | Wyomissing Borough | 29 | 5,368(0.54%)#25 | 201,796(0.01%)#812 |
| 26. | Millbourne Borough | 29 | 5,368(0.54%)#26 | 201,796(0.01%)#815 |
| 27. | East York | 27 | 5,368(0.50%)#27 | 201,796(0.01%)#834 |
| 28. | West Hazleton Borough | 26 | 5,368(0.48%)#28 | 201,796(0.01%)#846 |
| 29. | Roslyn | 25 | 5,368(0.47%)#29 | 201,796(0.01%)#860 |
| 30. | West View Borough | 24 | 5,368(0.45%)#30 | 201,796(0.01%)#882 |
| 31. | Erie | 21 | 5,368(0.39%)#31 | 201,796(0.01%)#918 |
| 32. | Collingdale Borough | 21 | 5,368(0.39%)#32 | 201,796(0.01%)#930 |
| 33. | Lorane | 20 | 5,368(0.37%)#33 | 201,796(0.01%)#954 |
| 34. | Wilkes Barre | 19 | 5,368(0.35%)#34 | 201,796(0.01%)#960 |
| 35. | York | 17 | 5,368(0.32%)#35 | 201,796(0.01%)#1,002 |
| 36. | Indiana Borough | 17 | 5,368(0.32%)#36 | 201,796(0.01%)#1,012 |
| 37. | Trafford Borough | 17 | 5,368(0.32%)#37 | 201,796(0.01%)#1,020 |
| 38. | Baldwin Borough | 14 | 5,368(0.26%)#38 | 201,796(0.01%)#1,082 |
| 39. | Yeadon Borough | 14 | 5,368(0.26%)#39 | 201,796(0.01%)#1,086 |
| 40. | Duquesne | 13 | 5,368(0.24%)#40 | 201,796(0.01%)#1,113 |
| 41. | Forest Hills Borough | 12 | 5,368(0.22%)#41 | 201,796(0.01%)#1,136 |
| 42. | Brookhaven Borough | 11 | 5,368(0.20%)#42 | 201,796(0.01%)#1,159 |
| 43. | Glenolden Borough | 11 | 5,368(0.20%)#43 | 201,796(0.01%)#1,161 |
| 44. | Glendon Borough | 10 | 5,368(0.19%)#44 | 201,796(0.00%)#1,188 |
| 45. | King Of Prussia | 7 | 5,368(0.13%)#45 | 201,796(0.00%)#1,257 |
| 46. | Tyler Run | 7 | 5,368(0.13%)#46 | 201,796(0.00%)#1,269 |
| 47. | Prospect Park Borough | 6 | 5,368(0.11%)#47 | 201,796(0.00%)#1,289 |
| 48. | Lincoln University | 6 | 5,368(0.11%)#48 | 201,796(0.00%)#1,299 |
| 49. | Penn State Erie Behrend | 6 | 5,368(0.11%)#49 | 201,796(0.00%)#1,301 |
| 50. | Chester | 4 | 5,368(0.07%)#50 | 201,796(0.00%)#1,344 |
| 51. | Carnot Moon | 4 | 5,368(0.07%)#51 | 201,796(0.00%)#1,350 |
| 52. | Wernersville Borough | 4 | 5,368(0.07%)#52 | 201,796(0.00%)#1,355 |
| 53. | New Bethlehem Borough | 4 | 5,368(0.07%)#53 | 201,796(0.00%)#1,361 |
| 54. | Seward Borough | 3 | 5,368(0.06%)#54 | 201,796(0.00%)#1,391 |
| 55. | Vinco | 2 | 5,368(0.04%)#55 | 201,796(0.00%)#1,405 |
Common Questions
What are the Top 10 Cities with the Most Immigrants from Ghana in Pennsylvania?
Top 10 Cities with the Most Immigrants from Ghana in Pennsylvania are:
#1
1,871
#2
148
#3
106
#4
85
#5
83
#6
72
#7
70
#8
65
#9
58
#10
58
What city has the Most Immigrants from Ghana in Pennsylvania?
Philadelphia has the Most Immigrants from Ghana in Pennsylvania with 1,871.
What is the Total Immigrants from Ghana in the State of Pennsylvania?
Total Immigrants from Ghana in Pennsylvania is 5,368.
What is the Total Immigrants from Ghana in the United States?
Total Immigrants from Ghana in the United States is 201,796.