Cities with the Largest South American Indian Community in Virginia
RELATED REPORTS & OPTIONS
South American Indian
Virginia
Compare Cities
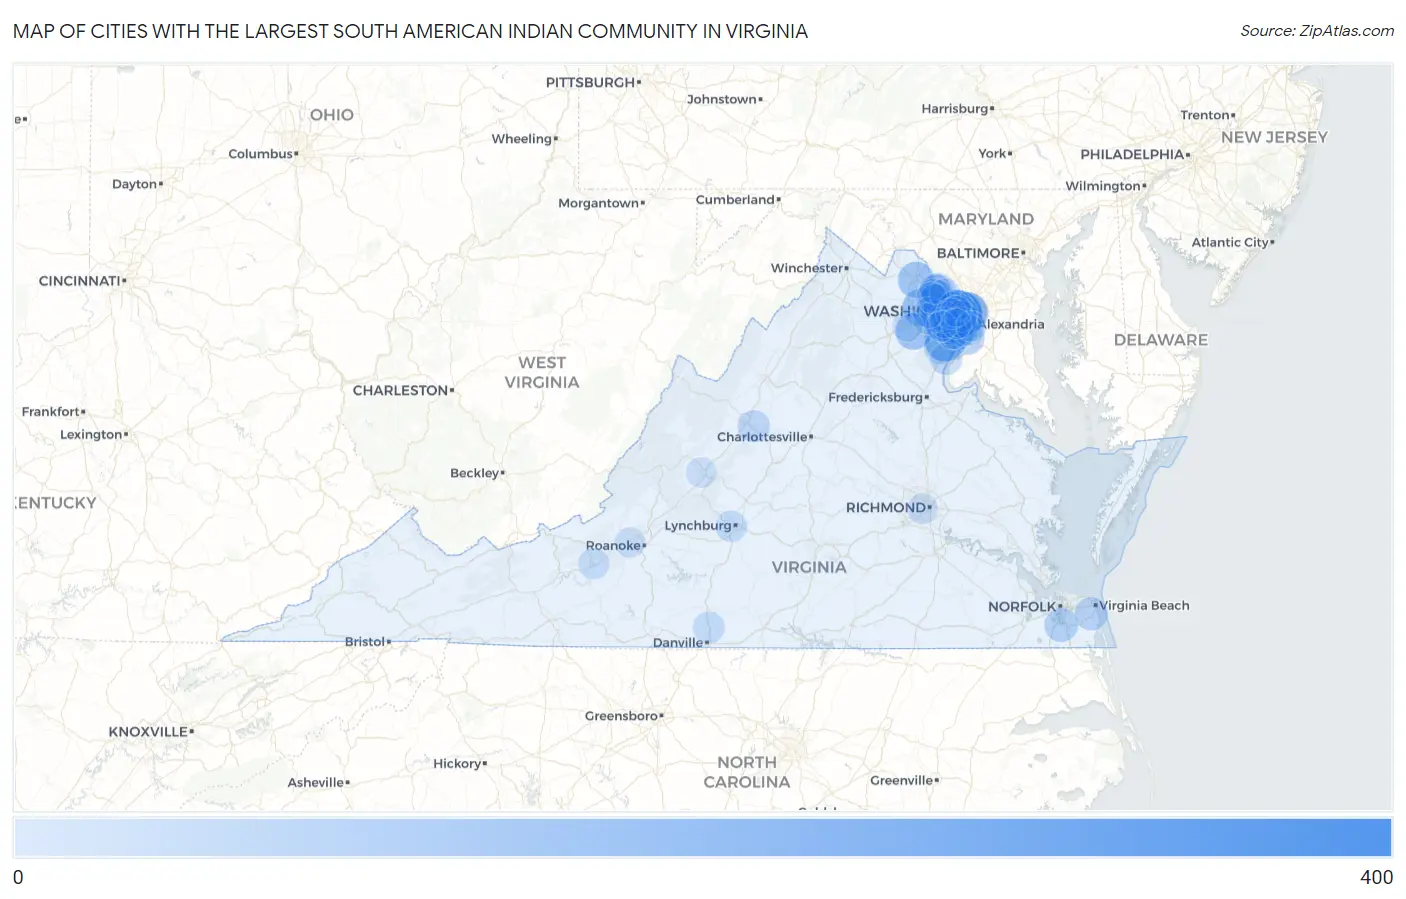
Map of Cities with the Largest South American Indian Community in Virginia
0
400
Cities with the Largest South American Indian Community in Virginia
| City | South American Indian | vs State | vs National | |
| 1. | West Falls Church | 340 | 3,095(10.99%)#1 | 61,478(0.55%)#11 |
| 2. | George Mason | 189 | 3,095(6.11%)#2 | 61,478(0.31%)#44 |
| 3. | Arlington | 182 | 3,095(5.88%)#3 | 61,478(0.30%)#49 |
| 4. | Lake Ridge | 177 | 3,095(5.72%)#4 | 61,478(0.29%)#50 |
| 5. | South Riding | 130 | 3,095(4.20%)#5 | 61,478(0.21%)#73 |
| 6. | Linton Hall | 115 | 3,095(3.72%)#6 | 61,478(0.19%)#87 |
| 7. | Leesburg | 107 | 3,095(3.46%)#7 | 61,478(0.17%)#100 |
| 8. | Springfield | 92 | 3,095(2.97%)#8 | 61,478(0.15%)#120 |
| 9. | Falls Church | 84 | 3,095(2.71%)#9 | 61,478(0.14%)#138 |
| 10. | Franconia | 83 | 3,095(2.68%)#10 | 61,478(0.14%)#141 |
| 11. | West Springfield | 76 | 3,095(2.46%)#11 | 61,478(0.12%)#150 |
| 12. | Reston | 70 | 3,095(2.26%)#12 | 61,478(0.11%)#173 |
| 13. | Mount Vernon | 70 | 3,095(2.26%)#13 | 61,478(0.11%)#175 |
| 14. | Braddock | 67 | 3,095(2.16%)#14 | 61,478(0.11%)#185 |
| 15. | Chesapeake | 62 | 3,095(2.00%)#15 | 61,478(0.10%)#200 |
| 16. | Burke | 59 | 3,095(1.91%)#16 | 61,478(0.10%)#216 |
| 17. | Virginia Beach | 54 | 3,095(1.74%)#17 | 61,478(0.09%)#244 |
| 18. | Lowes Island | 51 | 3,095(1.65%)#18 | 61,478(0.08%)#262 |
| 19. | Sugarland Run | 47 | 3,095(1.52%)#19 | 61,478(0.08%)#291 |
| 20. | Oakton | 46 | 3,095(1.49%)#20 | 61,478(0.07%)#298 |
| 21. | Dale City | 44 | 3,095(1.42%)#21 | 61,478(0.07%)#312 |
| 22. | Dranesville | 42 | 3,095(1.36%)#22 | 61,478(0.07%)#331 |
| 23. | Sterling | 41 | 3,095(1.32%)#23 | 61,478(0.07%)#341 |
| 24. | Cherry Hill | 37 | 3,095(1.20%)#24 | 61,478(0.06%)#364 |
| 25. | Fishersville | 34 | 3,095(1.10%)#25 | 61,478(0.06%)#387 |
| 26. | Fair Lakes | 32 | 3,095(1.03%)#26 | 61,478(0.05%)#409 |
| 27. | Herndon | 29 | 3,095(0.94%)#27 | 61,478(0.05%)#429 |
| 28. | Tysons | 28 | 3,095(0.90%)#28 | 61,478(0.05%)#438 |
| 29. | Newington | 28 | 3,095(0.90%)#29 | 61,478(0.05%)#442 |
| 30. | Centreville | 27 | 3,095(0.87%)#30 | 61,478(0.04%)#445 |
| 31. | Blairs | 27 | 3,095(0.87%)#31 | 61,478(0.04%)#460 |
| 32. | Fairfax | 22 | 3,095(0.71%)#32 | 61,478(0.04%)#531 |
| 33. | Hutchison | 21 | 3,095(0.68%)#33 | 61,478(0.03%)#544 |
| 34. | Lynchburg | 19 | 3,095(0.61%)#34 | 61,478(0.03%)#571 |
| 35. | Christiansburg | 18 | 3,095(0.58%)#35 | 61,478(0.03%)#594 |
| 36. | Groveton | 18 | 3,095(0.58%)#36 | 61,478(0.03%)#596 |
| 37. | Lake Barcroft | 18 | 3,095(0.58%)#37 | 61,478(0.03%)#597 |
| 38. | Midlothian | 17 | 3,095(0.55%)#38 | 61,478(0.03%)#615 |
| 39. | Newington Forest | 17 | 3,095(0.55%)#39 | 61,478(0.03%)#616 |
| 40. | Mclean | 13 | 3,095(0.42%)#40 | 61,478(0.02%)#693 |
| 41. | Kings Park West | 13 | 3,095(0.42%)#41 | 61,478(0.02%)#702 |
| 42. | Chantilly | 12 | 3,095(0.39%)#42 | 61,478(0.02%)#727 |
| 43. | Cascades | 12 | 3,095(0.39%)#43 | 61,478(0.02%)#736 |
| 44. | Gainesville | 10 | 3,095(0.32%)#44 | 61,478(0.02%)#801 |
| 45. | Great Falls | 10 | 3,095(0.32%)#45 | 61,478(0.02%)#804 |
| 46. | Lincolnia | 9 | 3,095(0.29%)#46 | 61,478(0.01%)#838 |
| 47. | Difficult Run | 9 | 3,095(0.29%)#47 | 61,478(0.01%)#844 |
| 48. | Oak Grove | 9 | 3,095(0.29%)#48 | 61,478(0.01%)#849 |
| 49. | Merrifield | 8 | 3,095(0.26%)#49 | 61,478(0.01%)#867 |
| 50. | Idylwood | 8 | 3,095(0.26%)#50 | 61,478(0.01%)#868 |
| 51. | Richmond | 7 | 3,095(0.23%)#51 | 61,478(0.01%)#888 |
| 52. | Fairfax Station | 7 | 3,095(0.23%)#52 | 61,478(0.01%)#909 |
| 53. | Salem | 6 | 3,095(0.19%)#53 | 61,478(0.01%)#936 |
| 54. | Lexington | 6 | 3,095(0.19%)#54 | 61,478(0.01%)#944 |
| 55. | Huntington | 4 | 3,095(0.13%)#55 | 61,478(0.01%)#986 |
| 56. | North Springfield | 2 | 3,095(0.06%)#56 | 61,478(0.00%)#1,032 |
Common Questions
What are the Top 10 Cities with the Largest South American Indian Community in Virginia?
Top 10 Cities with the Largest South American Indian Community in Virginia are:
#1
340
#2
189
#3
182
#4
177
#5
130
#6
115
#7
107
#8
92
#9
84
#10
83
What city has the Largest South American Indian Community in Virginia?
West Falls Church has the Largest South American Indian Community in Virginia with 340.
What is the Total South American Indian Population in the State of Virginia?
Total South American Indian Population in Virginia is 3,095.
What is the Total South American Indian Population in the United States?
Total South American Indian Population in the United States is 61,478.