Cities with the Most Immigrants from Colombia in Pennsylvania
RELATED REPORTS & OPTIONS
Colombia
Pennsylvania
Compare Cities
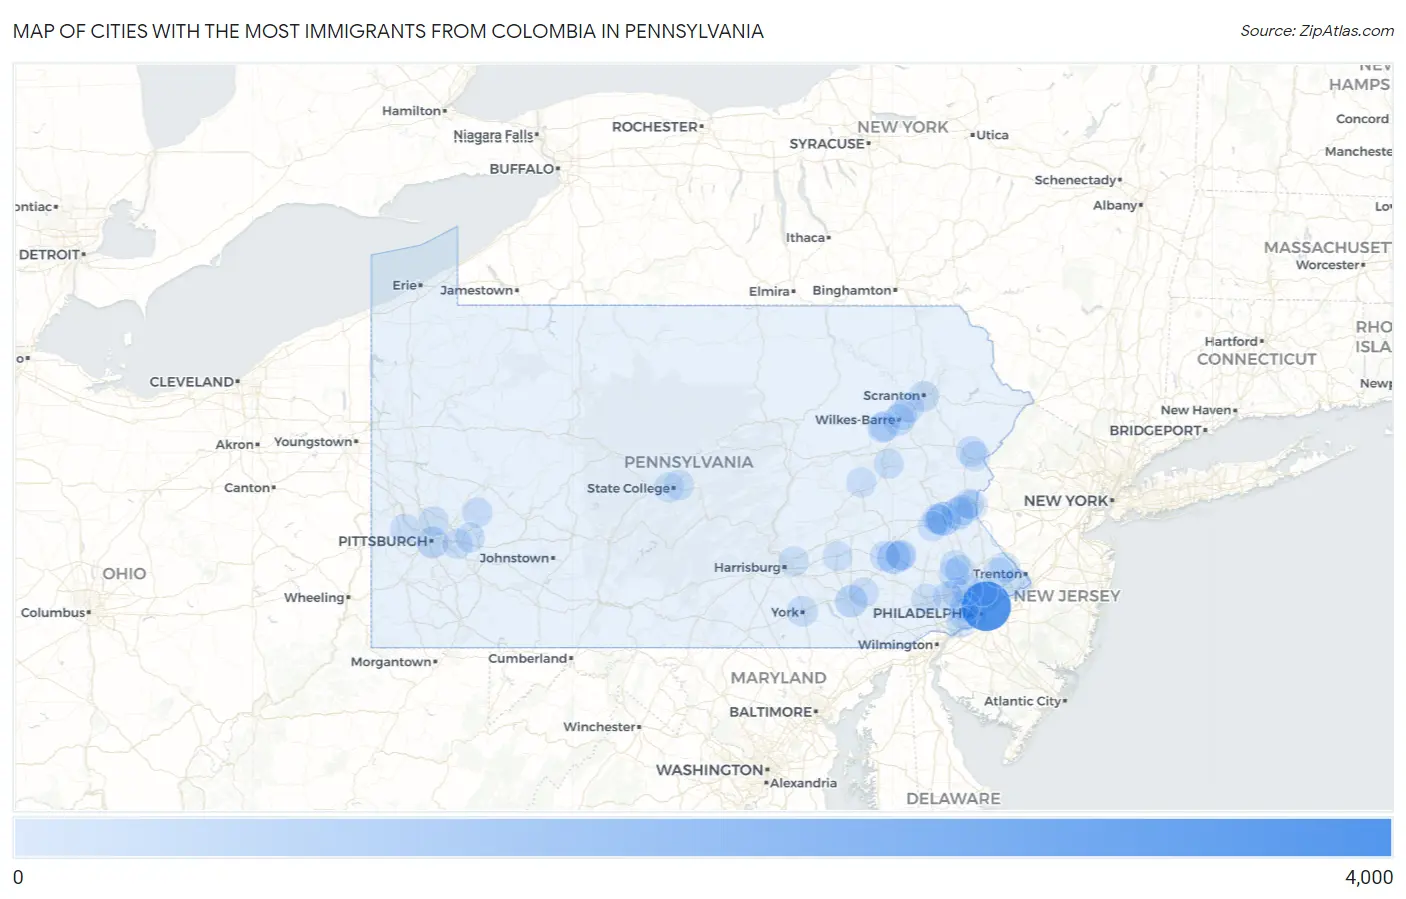
Map of Cities with the Most Immigrants from Colombia in Pennsylvania
0
4,000
Cities with the Most Immigrants from Colombia in Pennsylvania
| City | Colombia | vs State | vs National | |
| 1. | Philadelphia | 3,725 | 13,823(26.95%)#1 | 860,787(0.43%)#24 |
| 2. | Allentown | 716 | 13,823(5.18%)#2 | 860,787(0.08%)#176 |
| 3. | Reading | 568 | 13,823(4.11%)#3 | 860,787(0.07%)#209 |
| 4. | Bethlehem | 461 | 13,823(3.34%)#4 | 860,787(0.05%)#251 |
| 5. | Lancaster | 419 | 13,823(3.03%)#5 | 860,787(0.05%)#280 |
| 6. | Pittsburgh | 348 | 13,823(2.52%)#6 | 860,787(0.04%)#340 |
| 7. | Shillington Borough | 278 | 13,823(2.01%)#7 | 860,787(0.03%)#432 |
| 8. | Wilkes Barre | 216 | 13,823(1.56%)#8 | 860,787(0.03%)#532 |
| 9. | Roslyn | 104 | 13,823(0.75%)#9 | 860,787(0.01%)#988 |
| 10. | York | 103 | 13,823(0.75%)#10 | 860,787(0.01%)#991 |
| 11. | Wilson Borough | 103 | 13,823(0.75%)#11 | 860,787(0.01%)#994 |
| 12. | Scranton | 100 | 13,823(0.72%)#12 | 860,787(0.01%)#1,009 |
| 13. | Easton | 92 | 13,823(0.67%)#13 | 860,787(0.01%)#1,070 |
| 14. | Hatboro Borough | 92 | 13,823(0.67%)#14 | 860,787(0.01%)#1,080 |
| 15. | Pennside | 87 | 13,823(0.63%)#15 | 860,787(0.01%)#1,121 |
| 16. | Pittston | 81 | 13,823(0.59%)#16 | 860,787(0.01%)#1,173 |
| 17. | Whitfield | 80 | 13,823(0.58%)#17 | 860,787(0.01%)#1,186 |
| 18. | Nanticoke | 77 | 13,823(0.56%)#18 | 860,787(0.01%)#1,222 |
| 19. | Chestnut Hill | 75 | 13,823(0.54%)#19 | 860,787(0.01%)#1,242 |
| 20. | Penn Estates | 74 | 13,823(0.54%)#20 | 860,787(0.01%)#1,254 |
| 21. | Catawissa Borough | 69 | 13,823(0.50%)#21 | 860,787(0.01%)#1,316 |
| 22. | Economy Borough | 62 | 13,823(0.45%)#22 | 860,787(0.01%)#1,388 |
| 23. | Lansford Borough | 60 | 13,823(0.43%)#23 | 860,787(0.01%)#1,434 |
| 24. | Middletown | 59 | 13,823(0.43%)#24 | 860,787(0.01%)#1,448 |
| 25. | Ardmore | 52 | 13,823(0.38%)#25 | 860,787(0.01%)#1,552 |
| 26. | Lewisburg Borough | 51 | 13,823(0.37%)#26 | 860,787(0.01%)#1,574 |
| 27. | Monroeville | 50 | 13,823(0.36%)#27 | 860,787(0.01%)#1,583 |
| 28. | Sheatown | 50 | 13,823(0.36%)#28 | 860,787(0.01%)#1,594 |
| 29. | Drexel Hill | 46 | 13,823(0.33%)#29 | 860,787(0.01%)#1,668 |
| 30. | Souderton Borough | 46 | 13,823(0.33%)#30 | 860,787(0.01%)#1,678 |
| 31. | Levittown | 44 | 13,823(0.32%)#31 | 860,787(0.01%)#1,712 |
| 32. | Brentwood Borough | 44 | 13,823(0.32%)#32 | 860,787(0.01%)#1,726 |
| 33. | Lansdale Borough | 43 | 13,823(0.31%)#33 | 860,787(0.00%)#1,745 |
| 34. | Norwood Borough | 42 | 13,823(0.30%)#34 | 860,787(0.00%)#1,768 |
| 35. | Skippack | 41 | 13,823(0.30%)#35 | 860,787(0.00%)#1,793 |
| 36. | Hazleton | 37 | 13,823(0.27%)#36 | 860,787(0.00%)#1,867 |
| 37. | Columbia Borough | 37 | 13,823(0.27%)#37 | 860,787(0.00%)#1,878 |
| 38. | Hyde Park | 36 | 13,823(0.26%)#38 | 860,787(0.00%)#1,927 |
| 39. | Lionville | 34 | 13,823(0.25%)#39 | 860,787(0.00%)#1,994 |
| 40. | Dorneyville | 33 | 13,823(0.24%)#40 | 860,787(0.00%)#2,033 |
| 41. | Stony Creek Mills | 33 | 13,823(0.24%)#41 | 860,787(0.00%)#2,040 |
| 42. | Plymouth Meeting | 32 | 13,823(0.23%)#42 | 860,787(0.00%)#2,064 |
| 43. | Steelton Borough | 32 | 13,823(0.23%)#43 | 860,787(0.00%)#2,066 |
| 44. | Somerset Borough | 32 | 13,823(0.23%)#44 | 860,787(0.00%)#2,067 |
| 45. | Cetronia | 32 | 13,823(0.23%)#45 | 860,787(0.00%)#2,072 |
| 46. | Mohnton Borough | 31 | 13,823(0.22%)#46 | 860,787(0.00%)#2,104 |
| 47. | King Of Prussia | 30 | 13,823(0.22%)#47 | 860,787(0.00%)#2,118 |
| 48. | Kennett Square Borough | 30 | 13,823(0.22%)#48 | 860,787(0.00%)#2,137 |
| 49. | Folcroft Borough | 29 | 13,823(0.21%)#49 | 860,787(0.00%)#2,180 |
| 50. | Telford Borough | 29 | 13,823(0.21%)#50 | 860,787(0.00%)#2,185 |
| 51. | Hatfield Borough | 29 | 13,823(0.21%)#51 | 860,787(0.00%)#2,190 |
| 52. | Park Forest Village | 28 | 13,823(0.20%)#52 | 860,787(0.00%)#2,215 |
| 53. | Shenandoah Heights | 28 | 13,823(0.20%)#53 | 860,787(0.00%)#2,230 |
| 54. | Ancient Oaks | 26 | 13,823(0.19%)#54 | 860,787(0.00%)#2,285 |
| 55. | Taylor Borough | 26 | 13,823(0.19%)#55 | 860,787(0.00%)#2,288 |
| 56. | Lemont | 26 | 13,823(0.19%)#56 | 860,787(0.00%)#2,299 |
| 57. | Harleysville | 24 | 13,823(0.17%)#57 | 860,787(0.00%)#2,357 |
| 58. | Kulpsville | 24 | 13,823(0.17%)#58 | 860,787(0.00%)#2,358 |
| 59. | Norristown Borough | 22 | 13,823(0.16%)#59 | 860,787(0.00%)#2,429 |
| 60. | Elkins Park | 22 | 13,823(0.16%)#60 | 860,787(0.00%)#2,453 |
| 61. | Arlington Heights | 22 | 13,823(0.16%)#61 | 860,787(0.00%)#2,454 |
| 62. | Chesterbrook | 22 | 13,823(0.16%)#62 | 860,787(0.00%)#2,456 |
| 63. | West Reading Borough | 22 | 13,823(0.16%)#63 | 860,787(0.00%)#2,457 |
| 64. | Mount Penn Borough | 22 | 13,823(0.16%)#64 | 860,787(0.00%)#2,461 |
| 65. | State College Borough | 21 | 13,823(0.15%)#65 | 860,787(0.00%)#2,477 |
| 66. | Lebanon | 21 | 13,823(0.15%)#66 | 860,787(0.00%)#2,483 |
| 67. | Phoenixville Borough | 21 | 13,823(0.15%)#67 | 860,787(0.00%)#2,489 |
| 68. | Colonial Park | 21 | 13,823(0.15%)#68 | 860,787(0.00%)#2,491 |
| 69. | Doylestown Borough | 20 | 13,823(0.14%)#69 | 860,787(0.00%)#2,556 |
| 70. | Ridley Park Borough | 20 | 13,823(0.14%)#70 | 860,787(0.00%)#2,561 |
| 71. | Riverside Borough | 20 | 13,823(0.14%)#71 | 860,787(0.00%)#2,567 |
| 72. | Folsom | 18 | 13,823(0.13%)#72 | 860,787(0.00%)#2,646 |
| 73. | New Holland Borough | 18 | 13,823(0.13%)#73 | 860,787(0.00%)#2,652 |
| 74. | Dickson City Borough | 17 | 13,823(0.12%)#74 | 860,787(0.00%)#2,722 |
| 75. | Palmer Heights | 16 | 13,823(0.12%)#75 | 860,787(0.00%)#2,795 |
| 76. | Allison Park | 15 | 13,823(0.11%)#76 | 860,787(0.00%)#2,838 |
| 77. | New Hope Borough | 15 | 13,823(0.11%)#77 | 860,787(0.00%)#2,879 |
| 78. | East Stroudsburg Borough | 14 | 13,823(0.10%)#78 | 860,787(0.00%)#2,923 |
| 79. | Eagleville Cdp Montgomery County | 14 | 13,823(0.10%)#79 | 860,787(0.00%)#2,936 |
| 80. | Chalfont Borough | 14 | 13,823(0.10%)#80 | 860,787(0.00%)#2,939 |
| 81. | Freemansburg Borough | 14 | 13,823(0.10%)#81 | 860,787(0.00%)#2,948 |
| 82. | Akron Borough | 13 | 13,823(0.09%)#82 | 860,787(0.00%)#3,011 |
| 83. | Alburtis Borough | 13 | 13,823(0.09%)#83 | 860,787(0.00%)#3,017 |
| 84. | Roseto Borough | 13 | 13,823(0.09%)#84 | 860,787(0.00%)#3,021 |
| 85. | Carnot Moon | 12 | 13,823(0.09%)#85 | 860,787(0.00%)#3,047 |
| 86. | Bala Cynwyd | 12 | 13,823(0.09%)#86 | 860,787(0.00%)#3,059 |
| 87. | Swarthmore Borough | 12 | 13,823(0.09%)#87 | 860,787(0.00%)#3,066 |
| 88. | Wrightsville Borough | 12 | 13,823(0.09%)#88 | 860,787(0.00%)#3,083 |
| 89. | East Bangor Borough | 12 | 13,823(0.09%)#89 | 860,787(0.00%)#3,094 |
| 90. | Glenside | 11 | 13,823(0.08%)#90 | 860,787(0.00%)#3,137 |
| 91. | Newtown Grant | 11 | 13,823(0.08%)#91 | 860,787(0.00%)#3,146 |
| 92. | Wind Gap Borough | 11 | 13,823(0.08%)#92 | 860,787(0.00%)#3,161 |
| 93. | St Clair Borough | 11 | 13,823(0.08%)#93 | 860,787(0.00%)#3,163 |
| 94. | Murrysville | 10 | 13,823(0.07%)#94 | 860,787(0.00%)#3,200 |
| 95. | Richboro | 10 | 13,823(0.07%)#95 | 860,787(0.00%)#3,225 |
| 96. | Plains | 10 | 13,823(0.07%)#96 | 860,787(0.00%)#3,237 |
| 97. | Southmont Borough | 10 | 13,823(0.07%)#97 | 860,787(0.00%)#3,249 |
| 98. | Schellsburg Borough | 10 | 13,823(0.07%)#98 | 860,787(0.00%)#3,258 |
| 99. | Leola | 9 | 13,823(0.07%)#99 | 860,787(0.00%)#3,315 |
| 100. | Beaver Borough | 9 | 13,823(0.07%)#100 | 860,787(0.00%)#3,333 |
Common Questions
What are the Top 10 Cities with the Most Immigrants from Colombia in Pennsylvania?
Top 10 Cities with the Most Immigrants from Colombia in Pennsylvania are:
#1
3,725
#2
716
#3
568
#4
461
#5
419
#6
348
#7
216
#8
103
#9
100
#10
92
What city has the Most Immigrants from Colombia in Pennsylvania?
Philadelphia has the Most Immigrants from Colombia in Pennsylvania with 3,725.
What is the Total Immigrants from Colombia in the State of Pennsylvania?
Total Immigrants from Colombia in Pennsylvania is 13,823.
What is the Total Immigrants from Colombia in the United States?
Total Immigrants from Colombia in the United States is 860,787.