Cities with the Most Immigrants from Colombia in Michigan
RELATED REPORTS & OPTIONS
Colombia
Michigan
Compare Cities
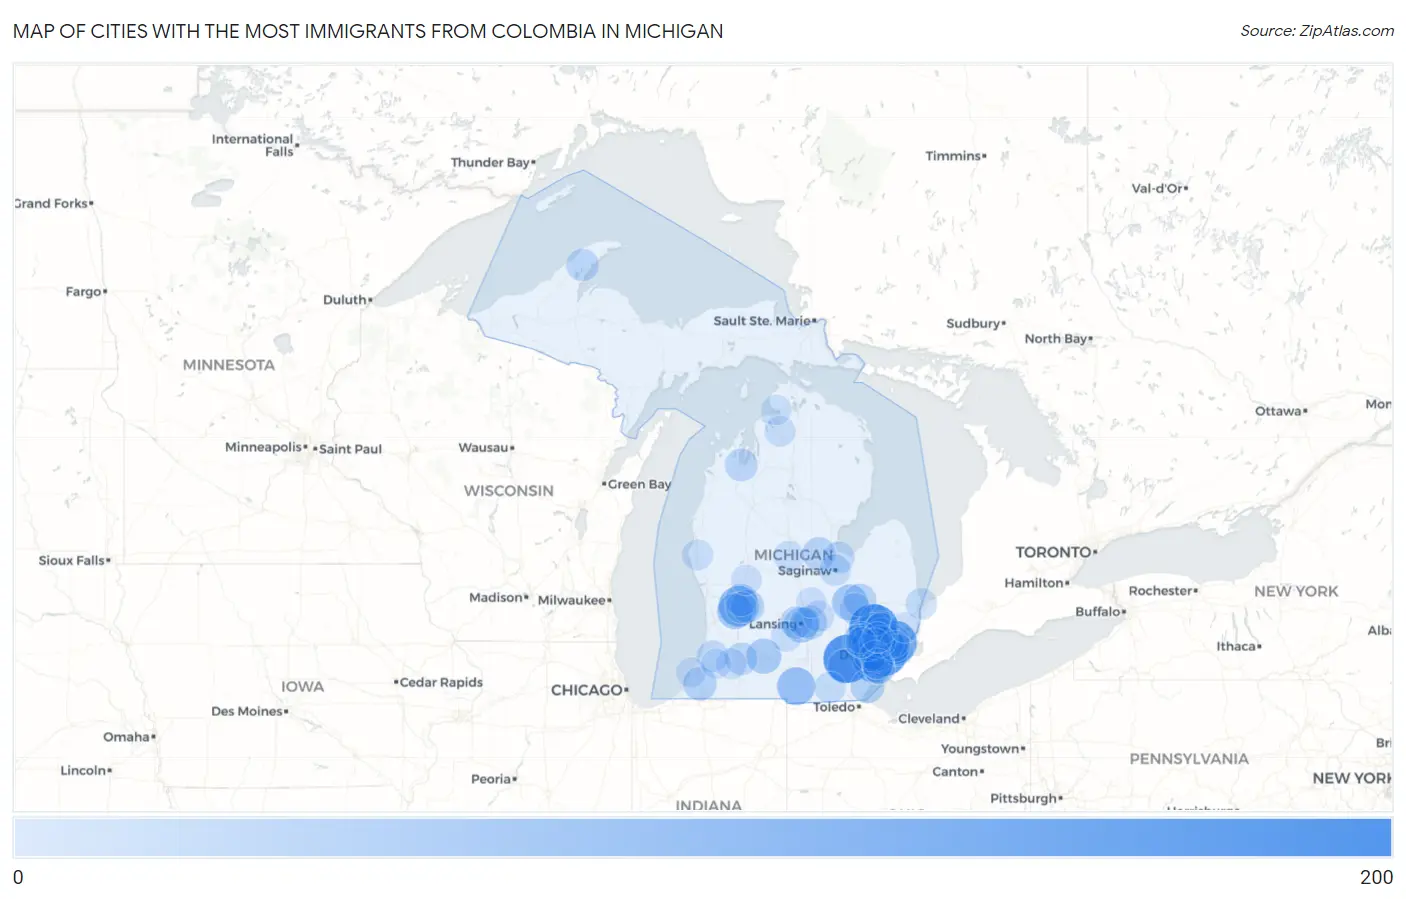
Map of Cities with the Most Immigrants from Colombia in Michigan
0
200
Cities with the Most Immigrants from Colombia in Michigan
| City | Colombia | vs State | vs National | |
| 1. | Auburn Hills | 193 | 3,969(4.86%)#1 | 860,787(0.02%)#582 |
| 2. | Ann Arbor | 179 | 3,969(4.51%)#2 | 860,787(0.02%)#617 |
| 3. | Detroit | 170 | 3,969(4.28%)#3 | 860,787(0.02%)#652 |
| 4. | St Clair Shores | 133 | 3,969(3.35%)#4 | 860,787(0.02%)#810 |
| 5. | Grand Rapids | 100 | 3,969(2.52%)#5 | 860,787(0.01%)#1,005 |
| 6. | Taylor | 97 | 3,969(2.44%)#6 | 860,787(0.01%)#1,025 |
| 7. | Farmington Hills | 77 | 3,969(1.94%)#7 | 860,787(0.01%)#1,215 |
| 8. | Hillsdale | 76 | 3,969(1.91%)#8 | 860,787(0.01%)#1,233 |
| 9. | Westland | 59 | 3,969(1.49%)#9 | 860,787(0.01%)#1,437 |
| 10. | Flint | 57 | 3,969(1.44%)#10 | 860,787(0.01%)#1,465 |
| 11. | Wyoming | 53 | 3,969(1.34%)#11 | 860,787(0.01%)#1,529 |
| 12. | Lansing | 49 | 3,969(1.23%)#12 | 860,787(0.01%)#1,596 |
| 13. | Battle Creek | 48 | 3,969(1.21%)#13 | 860,787(0.01%)#1,622 |
| 14. | Pontiac | 44 | 3,969(1.11%)#14 | 860,787(0.01%)#1,711 |
| 15. | Saline | 39 | 3,969(0.98%)#15 | 860,787(0.00%)#1,825 |
| 16. | Pleasant Ridge | 38 | 3,969(0.96%)#16 | 860,787(0.00%)#1,858 |
| 17. | Roseville | 37 | 3,969(0.93%)#17 | 860,787(0.00%)#1,864 |
| 18. | Monroe | 34 | 3,969(0.86%)#18 | 860,787(0.00%)#1,984 |
| 19. | Haslett | 34 | 3,969(0.86%)#19 | 860,787(0.00%)#1,985 |
| 20. | Dearborn | 33 | 3,969(0.83%)#20 | 860,787(0.00%)#2,005 |
| 21. | Berrien Springs | 33 | 3,969(0.83%)#21 | 860,787(0.00%)#2,039 |
| 22. | Warren | 32 | 3,969(0.81%)#22 | 860,787(0.00%)#2,042 |
| 23. | Troy | 31 | 3,969(0.78%)#23 | 860,787(0.00%)#2,078 |
| 24. | Midland | 30 | 3,969(0.76%)#24 | 860,787(0.00%)#2,110 |
| 25. | Forest Hills | 30 | 3,969(0.76%)#25 | 860,787(0.00%)#2,114 |
| 26. | Davison | 25 | 3,969(0.63%)#26 | 860,787(0.00%)#2,327 |
| 27. | Traverse City | 24 | 3,969(0.60%)#27 | 860,787(0.00%)#2,352 |
| 28. | Kalamazoo | 22 | 3,969(0.55%)#28 | 860,787(0.00%)#2,420 |
| 29. | Rochester | 22 | 3,969(0.55%)#29 | 860,787(0.00%)#2,443 |
| 30. | Lake Linden | 22 | 3,969(0.55%)#30 | 860,787(0.00%)#2,468 |
| 31. | Waverly | 20 | 3,969(0.50%)#31 | 860,787(0.00%)#2,535 |
| 32. | Northview | 20 | 3,969(0.50%)#32 | 860,787(0.00%)#2,544 |
| 33. | Garden City | 19 | 3,969(0.48%)#33 | 860,787(0.00%)#2,585 |
| 34. | Riverview | 17 | 3,969(0.43%)#34 | 860,787(0.00%)#2,706 |
| 35. | Farmington | 16 | 3,969(0.40%)#35 | 860,787(0.00%)#2,778 |
| 36. | Bangor | 16 | 3,969(0.40%)#36 | 860,787(0.00%)#2,808 |
| 37. | Bay City | 15 | 3,969(0.38%)#37 | 860,787(0.00%)#2,830 |
| 38. | Rochester Hills | 14 | 3,969(0.35%)#38 | 860,787(0.00%)#2,892 |
| 39. | Saginaw | 14 | 3,969(0.35%)#39 | 860,787(0.00%)#2,899 |
| 40. | Grosse Pointe Farms | 14 | 3,969(0.35%)#40 | 860,787(0.00%)#2,922 |
| 41. | Royal Oak | 13 | 3,969(0.33%)#41 | 860,787(0.00%)#2,967 |
| 42. | Grand Blanc | 13 | 3,969(0.33%)#42 | 860,787(0.00%)#2,997 |
| 43. | Port Huron | 12 | 3,969(0.30%)#43 | 860,787(0.00%)#3,030 |
| 44. | Adrian | 12 | 3,969(0.30%)#44 | 860,787(0.00%)#3,035 |
| 45. | Wolverine Lake | 11 | 3,969(0.28%)#45 | 860,787(0.00%)#3,152 |
| 46. | Wixom | 9 | 3,969(0.23%)#46 | 860,787(0.00%)#3,292 |
| 47. | East Grand Rapids | 9 | 3,969(0.23%)#47 | 860,787(0.00%)#3,302 |
| 48. | Lake Orion | 9 | 3,969(0.23%)#48 | 860,787(0.00%)#3,343 |
| 49. | Southfield | 8 | 3,969(0.20%)#49 | 860,787(0.00%)#3,369 |
| 50. | Dearborn Heights | 8 | 3,969(0.20%)#50 | 860,787(0.00%)#3,370 |
| 51. | Trenton | 8 | 3,969(0.20%)#51 | 860,787(0.00%)#3,396 |
| 52. | Mattawan | 8 | 3,969(0.20%)#52 | 860,787(0.00%)#3,443 |
| 53. | Perry | 8 | 3,969(0.20%)#53 | 860,787(0.00%)#3,446 |
| 54. | Grosse Pointe Woods | 7 | 3,969(0.18%)#54 | 860,787(0.00%)#3,490 |
| 55. | Charlotte | 7 | 3,969(0.18%)#55 | 860,787(0.00%)#3,509 |
| 56. | Shelby | 7 | 3,969(0.18%)#56 | 860,787(0.00%)#3,536 |
| 57. | East Lansing | 6 | 3,969(0.15%)#57 | 860,787(0.00%)#3,570 |
| 58. | Southgate | 6 | 3,969(0.15%)#58 | 860,787(0.00%)#3,575 |
| 59. | Mount Pleasant | 6 | 3,969(0.15%)#59 | 860,787(0.00%)#3,579 |
| 60. | Boyne Falls | 6 | 3,969(0.15%)#60 | 860,787(0.00%)#3,648 |
| 61. | Novi | 5 | 3,969(0.13%)#61 | 860,787(0.00%)#3,653 |
| 62. | Birmingham | 4 | 3,969(0.10%)#62 | 860,787(0.00%)#3,762 |
| 63. | Ovid | 4 | 3,969(0.10%)#63 | 860,787(0.00%)#3,809 |
| 64. | Sand Lake | 4 | 3,969(0.10%)#64 | 860,787(0.00%)#3,831 |
| 65. | Harbor Springs | 2 | 3,969(0.05%)#65 | 860,787(0.00%)#3,950 |
| 66. | New Baltimore | 1 | 3,969(0.03%)#66 | 860,787(0.00%)#4,010 |
| 67. | St Joseph | 1 | 3,969(0.03%)#67 | 860,787(0.00%)#4,016 |
| 68. | Lawrence | 1 | 3,969(0.03%)#68 | 860,787(0.00%)#4,051 |
Common Questions
What are the Top 10 Cities with the Most Immigrants from Colombia in Michigan?
Top 10 Cities with the Most Immigrants from Colombia in Michigan are:
#1
193
#2
179
#3
170
#4
133
#5
100
#6
97
#7
77
#8
76
#9
59
#10
57
What city has the Most Immigrants from Colombia in Michigan?
Auburn Hills has the Most Immigrants from Colombia in Michigan with 193.
What is the Total Immigrants from Colombia in the State of Michigan?
Total Immigrants from Colombia in Michigan is 3,969.
What is the Total Immigrants from Colombia in the United States?
Total Immigrants from Colombia in the United States is 860,787.