Cities with the Most Immigrants from Australia in Ohio
RELATED REPORTS & OPTIONS
Australia
Ohio
Compare Cities
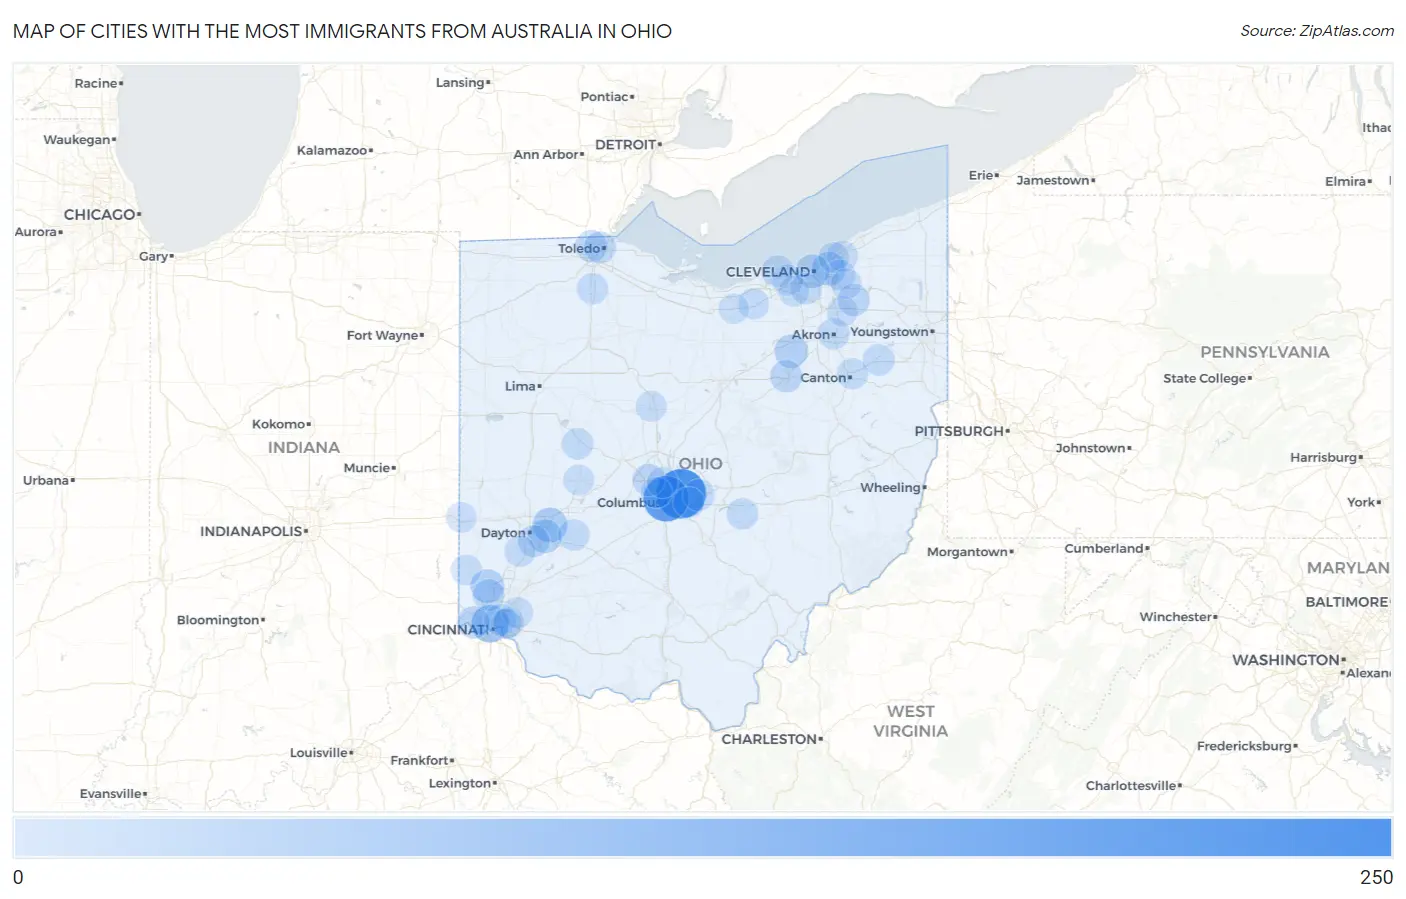
Map of Cities with the Most Immigrants from Australia in Ohio
0
250
Cities with the Most Immigrants from Australia in Ohio
| City | Australia | vs State | vs National | |
| 1. | Gahanna | 233 | 1,763(13.22%)#1 | 98,163(0.24%)#37 |
| 2. | Columbus | 186 | 1,763(10.55%)#2 | 98,163(0.19%)#59 |
| 3. | Cincinnati | 87 | 1,763(4.93%)#3 | 98,163(0.09%)#155 |
| 4. | Fairborn | 54 | 1,763(3.06%)#4 | 98,163(0.06%)#276 |
| 5. | Hamilton | 41 | 1,763(2.33%)#5 | 98,163(0.04%)#375 |
| 6. | Cleveland Heights | 41 | 1,763(2.33%)#6 | 98,163(0.04%)#377 |
| 7. | Beavercreek | 40 | 1,763(2.27%)#7 | 98,163(0.04%)#387 |
| 8. | Cleveland | 39 | 1,763(2.21%)#8 | 98,163(0.04%)#392 |
| 9. | Creston | 39 | 1,763(2.21%)#9 | 98,163(0.04%)#416 |
| 10. | Mack | 26 | 1,763(1.47%)#10 | 98,163(0.03%)#606 |
| 11. | Dublin | 25 | 1,763(1.42%)#11 | 98,163(0.03%)#622 |
| 12. | Wooster | 25 | 1,763(1.42%)#12 | 98,163(0.03%)#628 |
| 13. | Aurora | 22 | 1,763(1.25%)#13 | 98,163(0.02%)#714 |
| 14. | Fairfield | 20 | 1,763(1.13%)#14 | 98,163(0.02%)#764 |
| 15. | Ottawa Hills | 20 | 1,763(1.13%)#15 | 98,163(0.02%)#782 |
| 16. | Toledo | 19 | 1,763(1.08%)#16 | 98,163(0.02%)#789 |
| 17. | Kettering | 18 | 1,763(1.02%)#17 | 98,163(0.02%)#839 |
| 18. | Avon Lake | 18 | 1,763(1.02%)#18 | 98,163(0.02%)#844 |
| 19. | Pataskala | 17 | 1,763(0.96%)#19 | 98,163(0.02%)#886 |
| 20. | Akron | 16 | 1,763(0.91%)#20 | 98,163(0.02%)#905 |
| 21. | Norwood | 16 | 1,763(0.91%)#21 | 98,163(0.02%)#926 |
| 22. | Bellefontaine | 16 | 1,763(0.91%)#22 | 98,163(0.02%)#929 |
| 23. | Alliance | 15 | 1,763(0.85%)#23 | 98,163(0.02%)#962 |
| 24. | Cedarville | 14 | 1,763(0.79%)#24 | 98,163(0.01%)#1,051 |
| 25. | Glenford | 14 | 1,763(0.79%)#25 | 98,163(0.01%)#1,058 |
| 26. | Bowling Green | 13 | 1,763(0.74%)#26 | 98,163(0.01%)#1,081 |
| 27. | Parma Heights | 13 | 1,763(0.74%)#27 | 98,163(0.01%)#1,087 |
| 28. | Canton | 11 | 1,763(0.62%)#28 | 98,163(0.01%)#1,182 |
| 29. | Upper Arlington | 11 | 1,763(0.62%)#29 | 98,163(0.01%)#1,193 |
| 30. | Reynoldsburg | 10 | 1,763(0.57%)#30 | 98,163(0.01%)#1,271 |
| 31. | Miamisburg | 10 | 1,763(0.57%)#31 | 98,163(0.01%)#1,287 |
| 32. | Worthington | 10 | 1,763(0.57%)#32 | 98,163(0.01%)#1,294 |
| 33. | Oberlin | 10 | 1,763(0.57%)#33 | 98,163(0.01%)#1,301 |
| 34. | Westlake | 9 | 1,763(0.51%)#34 | 98,163(0.01%)#1,358 |
| 35. | Willoughby Hills | 9 | 1,763(0.51%)#35 | 98,163(0.01%)#1,383 |
| 36. | Pepper Pike | 9 | 1,763(0.51%)#36 | 98,163(0.01%)#1,387 |
| 37. | Miamiville | 9 | 1,763(0.51%)#37 | 98,163(0.01%)#1,413 |
| 38. | Oxford | 8 | 1,763(0.45%)#38 | 98,163(0.01%)#1,442 |
| 39. | Euclid | 7 | 1,763(0.40%)#39 | 98,163(0.01%)#1,502 |
| 40. | Marion | 7 | 1,763(0.40%)#40 | 98,163(0.01%)#1,505 |
| 41. | Hudson | 7 | 1,763(0.40%)#41 | 98,163(0.01%)#1,513 |
| 42. | Urbana | 7 | 1,763(0.40%)#42 | 98,163(0.01%)#1,530 |
| 43. | Berea | 6 | 1,763(0.34%)#43 | 98,163(0.01%)#1,589 |
| 44. | Mariemont | 6 | 1,763(0.34%)#44 | 98,163(0.01%)#1,621 |
| 45. | Bentleyville | 5 | 1,763(0.28%)#45 | 98,163(0.01%)#1,706 |
| 46. | New Paris | 4 | 1,763(0.23%)#46 | 98,163(0.00%)#1,760 |
| 47. | Fairfax | 3 | 1,763(0.17%)#47 | 98,163(0.00%)#1,814 |
| 48. | Wakeman | 2 | 1,763(0.11%)#48 | 98,163(0.00%)#1,871 |
Common Questions
What are the Top 10 Cities with the Most Immigrants from Australia in Ohio?
Top 10 Cities with the Most Immigrants from Australia in Ohio are:
#1
233
#2
186
#3
87
#4
54
#5
41
#6
41
#7
40
#8
39
#9
39
#10
26
What city has the Most Immigrants from Australia in Ohio?
Gahanna has the Most Immigrants from Australia in Ohio with 233.
What is the Total Immigrants from Australia in the State of Ohio?
Total Immigrants from Australia in Ohio is 1,763.
What is the Total Immigrants from Australia in the United States?
Total Immigrants from Australia in the United States is 98,163.