Cities with the Most Immigrants from Australia in Pennsylvania
RELATED REPORTS & OPTIONS
Australia
Pennsylvania
Compare Cities
Map of Cities with the Most Immigrants from Australia in Pennsylvania
0
500
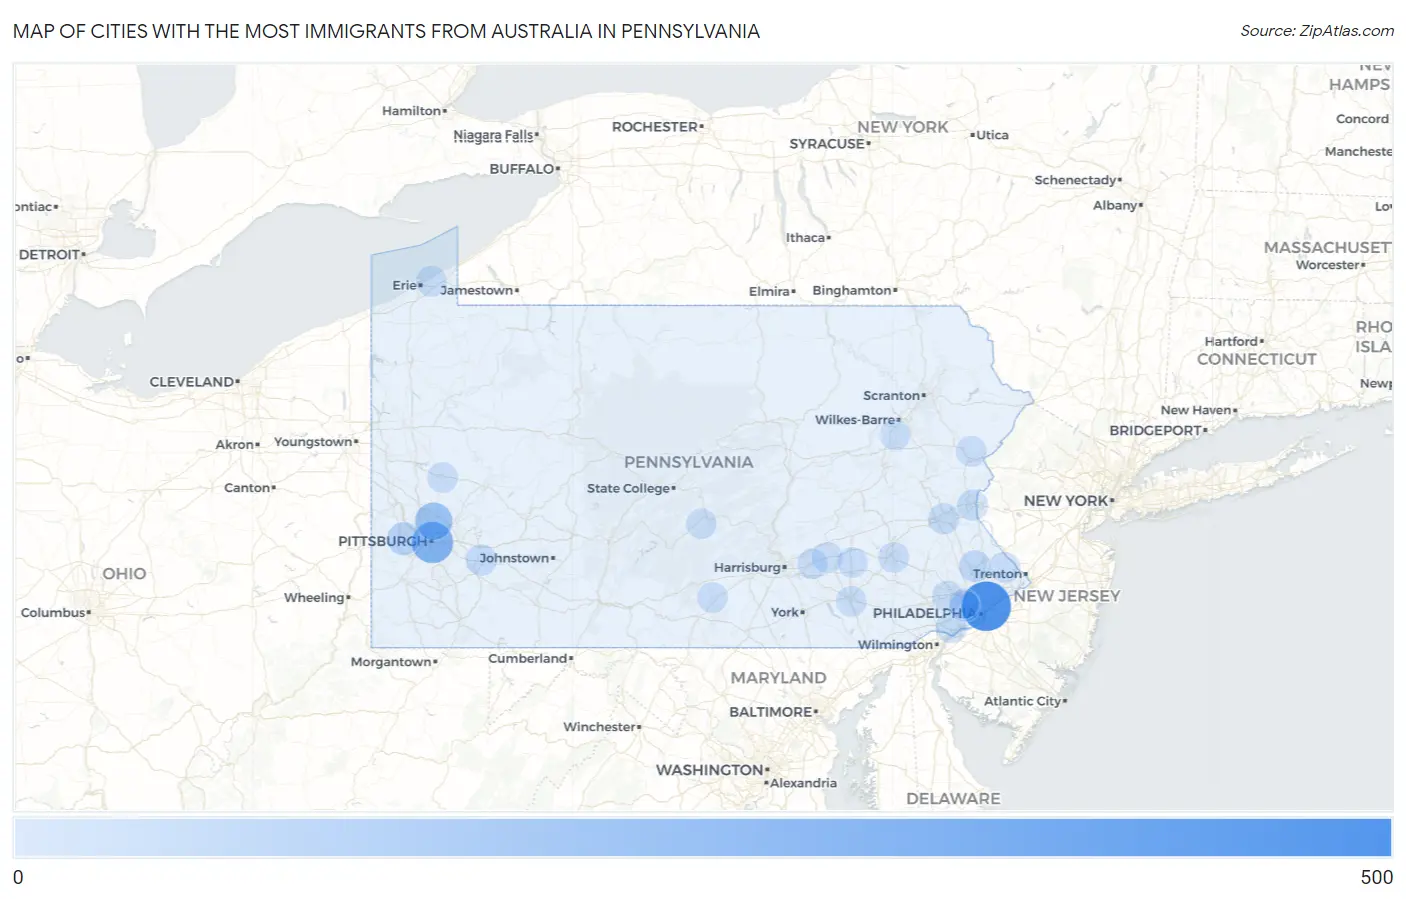
Cities with the Most Immigrants from Australia in Pennsylvania
| City | Australia | vs State | vs National | |
| 1. | Philadelphia | 401 | 2,506(16.00%)#1 | 98,163(0.41%)#17 |
| 2. | Pittsburgh | 227 | 2,506(9.06%)#2 | 98,163(0.23%)#41 |
| 3. | Allison Park | 145 | 2,506(5.79%)#3 | 98,163(0.15%)#85 |
| 4. | Pen Argyl Borough | 67 | 2,506(2.67%)#4 | 98,163(0.07%)#215 |
| 5. | Enlow | 57 | 2,506(2.27%)#5 | 98,163(0.06%)#259 |
| 6. | Phoenixville Borough | 49 | 2,506(1.96%)#6 | 98,163(0.05%)#306 |
| 7. | Blakely Borough | 42 | 2,506(1.68%)#7 | 98,163(0.04%)#368 |
| 8. | Brittany Farms The Highlands | 34 | 2,506(1.36%)#8 | 98,163(0.03%)#479 |
| 9. | Merion Station | 24 | 2,506(0.96%)#9 | 98,163(0.02%)#666 |
| 10. | Orwigsburg Borough | 24 | 2,506(0.96%)#10 | 98,163(0.02%)#670 |
| 11. | Village Green Green Ridge | 22 | 2,506(0.88%)#11 | 98,163(0.02%)#718 |
| 12. | Allentown | 21 | 2,506(0.84%)#12 | 98,163(0.02%)#728 |
| 13. | Franklin Park Borough | 21 | 2,506(0.84%)#13 | 98,163(0.02%)#744 |
| 14. | Grove City Borough | 20 | 2,506(0.80%)#14 | 98,163(0.02%)#780 |
| 15. | Greensburg | 19 | 2,506(0.76%)#15 | 98,163(0.02%)#811 |
| 16. | Millersville Borough | 18 | 2,506(0.72%)#16 | 98,163(0.02%)#865 |
| 17. | Easton | 17 | 2,506(0.68%)#17 | 98,163(0.02%)#880 |
| 18. | Carlisle Borough | 16 | 2,506(0.64%)#18 | 98,163(0.02%)#923 |
| 19. | Bridgeport Borough | 16 | 2,506(0.64%)#19 | 98,163(0.02%)#938 |
| 20. | Northwest Harborcreek | 15 | 2,506(0.60%)#20 | 98,163(0.02%)#977 |
| 21. | Chesterbrook | 15 | 2,506(0.60%)#21 | 98,163(0.02%)#982 |
| 22. | Castle Shannon Borough | 14 | 2,506(0.56%)#22 | 98,163(0.01%)#1,039 |
| 23. | Swarthmore Borough | 14 | 2,506(0.56%)#23 | 98,163(0.01%)#1,042 |
| 24. | Edgewood Borough | 13 | 2,506(0.52%)#24 | 98,163(0.01%)#1,110 |
| 25. | Danville Borough | 11 | 2,506(0.44%)#25 | 98,163(0.01%)#1,241 |
| 26. | Reading | 10 | 2,506(0.40%)#26 | 98,163(0.01%)#1,256 |
| 27. | Gettysburg Borough | 10 | 2,506(0.40%)#27 | 98,163(0.01%)#1,304 |
| 28. | Media Borough | 10 | 2,506(0.40%)#28 | 98,163(0.01%)#1,308 |
| 29. | Annville | 10 | 2,506(0.40%)#29 | 98,163(0.01%)#1,311 |
| 30. | Penn Estates | 10 | 2,506(0.40%)#30 | 98,163(0.01%)#1,312 |
| 31. | Millvale Borough | 10 | 2,506(0.40%)#31 | 98,163(0.01%)#1,314 |
| 32. | Butler | 9 | 2,506(0.36%)#32 | 98,163(0.01%)#1,375 |
| 33. | Lancaster | 8 | 2,506(0.32%)#33 | 98,163(0.01%)#1,424 |
| 34. | West Chester Borough | 8 | 2,506(0.32%)#34 | 98,163(0.01%)#1,443 |
| 35. | Shippensburg University | 7 | 2,506(0.28%)#35 | 98,163(0.01%)#1,555 |
| 36. | Watsontown Borough | 7 | 2,506(0.28%)#36 | 98,163(0.01%)#1,558 |
| 37. | Granville | 7 | 2,506(0.28%)#37 | 98,163(0.01%)#1,562 |
| 38. | Ardmore | 6 | 2,506(0.24%)#38 | 98,163(0.01%)#1,599 |
| 39. | State College Borough | 5 | 2,506(0.20%)#39 | 98,163(0.01%)#1,658 |
| 40. | Hershey | 5 | 2,506(0.20%)#40 | 98,163(0.01%)#1,669 |
| 41. | Mountain Top | 5 | 2,506(0.20%)#41 | 98,163(0.01%)#1,671 |
| 42. | Newtown Grant | 5 | 2,506(0.20%)#42 | 98,163(0.01%)#1,687 |
| 43. | Industry Borough | 5 | 2,506(0.20%)#43 | 98,163(0.01%)#1,701 |
| 44. | Schaefferstown | 5 | 2,506(0.20%)#44 | 98,163(0.01%)#1,705 |
| 45. | Bryn Mawr | 4 | 2,506(0.16%)#45 | 98,163(0.00%)#1,741 |
| 46. | Waymart Borough | 4 | 2,506(0.16%)#46 | 98,163(0.00%)#1,764 |
| 47. | Bryn Athyn Borough | 4 | 2,506(0.16%)#47 | 98,163(0.00%)#1,767 |
| 48. | Greenville Borough | 3 | 2,506(0.12%)#48 | 98,163(0.00%)#1,799 |
| 49. | Everson Borough | 3 | 2,506(0.12%)#49 | 98,163(0.00%)#1,832 |
| 50. | Chalfont Borough | 2 | 2,506(0.08%)#50 | 98,163(0.00%)#1,856 |
| 51. | Rose Valley Borough | 2 | 2,506(0.08%)#51 | 98,163(0.00%)#1,870 |
| 52. | Beavertown Borough | 2 | 2,506(0.08%)#52 | 98,163(0.00%)#1,876 |
| 53. | Mcewensville Borough | 2 | 2,506(0.08%)#53 | 98,163(0.00%)#1,898 |
| 54. | New Berlin Borough | 1 | 2,506(0.04%)#54 | 98,163(0.00%)#1,924 |
| 55. | Fawn Grove Borough | 1 | 2,506(0.04%)#55 | 98,163(0.00%)#1,930 |
Common Questions
What are the Top 10 Cities with the Most Immigrants from Australia in Pennsylvania?
Top 10 Cities with the Most Immigrants from Australia in Pennsylvania are:
#1
401
#2
227
#3
145
#4
57
#5
34
#6
22
#7
21
#8
19
#9
17
#10
15
What city has the Most Immigrants from Australia in Pennsylvania?
Philadelphia has the Most Immigrants from Australia in Pennsylvania with 401.
What is the Total Immigrants from Australia in the State of Pennsylvania?
Total Immigrants from Australia in Pennsylvania is 2,506.
What is the Total Immigrants from Australia in the United States?
Total Immigrants from Australia in the United States is 98,163.