Zip Codes with the Highest Percentage of Households with Income Below $10,000 in Vancouver, WA
RELATED REPORTS & OPTIONS
Household Income | $0-10k
Vancouver
Compare Zip Codes
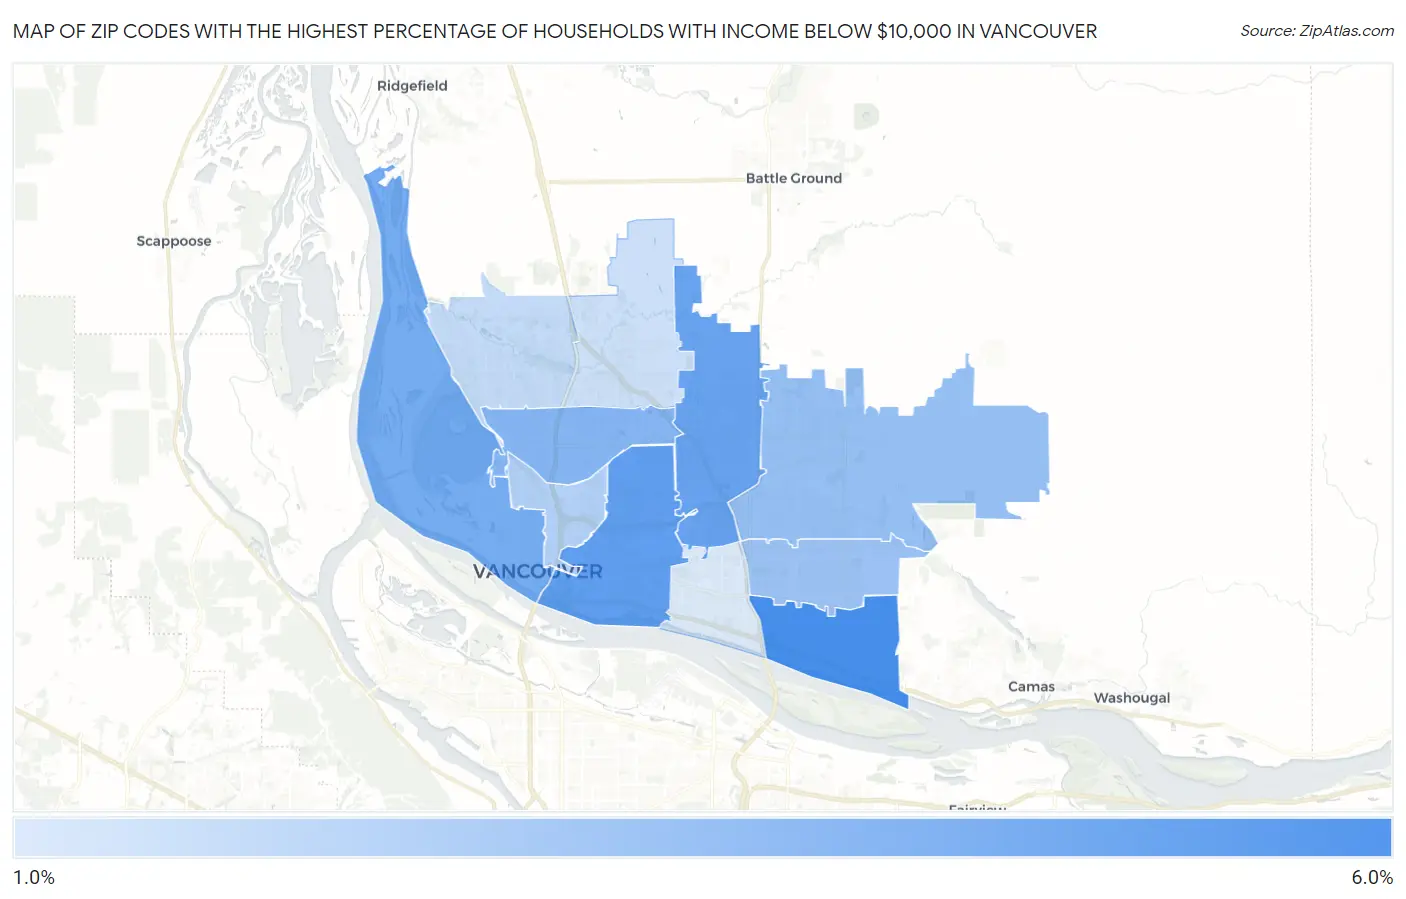
Map of Zip Codes with the Highest Percentage of Households with Income Below $10,000 in Vancouver
1.6%
5.2%
Zip Codes with the Highest Percentage of Households with Income Below $10,000 in Vancouver, WA
| Zip Code | Households with Income < $10k | vs State | vs National | |
| 1. | 98683 | 5.2% | 3.7%(+1.50)#133 | 4.9%(+0.300)#11,062 |
| 2. | 98661 | 4.6% | 3.7%(+0.900)#180 | 4.9%(-0.300)#12,968 |
| 3. | 98662 | 4.4% | 3.7%(+0.700)#196 | 4.9%(-0.500)#13,684 |
| 4. | 98660 | 4.1% | 3.7%(+0.400)#221 | 4.9%(-0.800)#14,934 |
| 5. | 98665 | 3.7% | 3.7%(=0.000)#241 | 4.9%(-1.20)#16,428 |
| 6. | 98682 | 3.3% | 3.7%(-0.400)#281 | 4.9%(-1.60)#18,032 |
| 7. | 98684 | 3.2% | 3.7%(-0.500)#292 | 4.9%(-1.70)#18,485 |
| 8. | 98663 | 2.6% | 3.7%(-1.10)#359 | 4.9%(-2.30)#21,190 |
| 9. | 98685 | 2.2% | 3.7%(-1.50)#397 | 4.9%(-2.70)#22,864 |
| 10. | 98686 | 2.0% | 3.7%(-1.70)#416 | 4.9%(-2.90)#23,648 |
| 11. | 98664 | 1.6% | 3.7%(-2.10)#449 | 4.9%(-3.30)#25,105 |
1
Common Questions
What are the Top 10 Zip Codes with the Highest Percentage of Households with Income Below $10,000 in Vancouver, WA?
Top 10 Zip Codes with the Highest Percentage of Households with Income Below $10,000 in Vancouver, WA are:
What zip code has the Highest Percentage of Households with Income Below $10,000 in Vancouver, WA?
98683 has the Highest Percentage of Households with Income Below $10,000 in Vancouver, WA with 5.2%.
What is the Percentage of Households with Income Below $10,000 in Vancouver, WA?
Percentage of Households with Income Below $10,000 in Vancouver is 4.3%.
What is the Percentage of Households with Income Below $10,000 in Washington?
Percentage of Households with Income Below $10,000 in Washington is 3.7%.
What is the Percentage of Households with Income Below $10,000 in the United States?
Percentage of Households with Income Below $10,000 in the United States is 4.9%.