Cities with the Highest Percentage of Households with Income Below $10,000 in Illinois
RELATED REPORTS & OPTIONS
Household Income | $0-10k
Illinois
Compare Cities
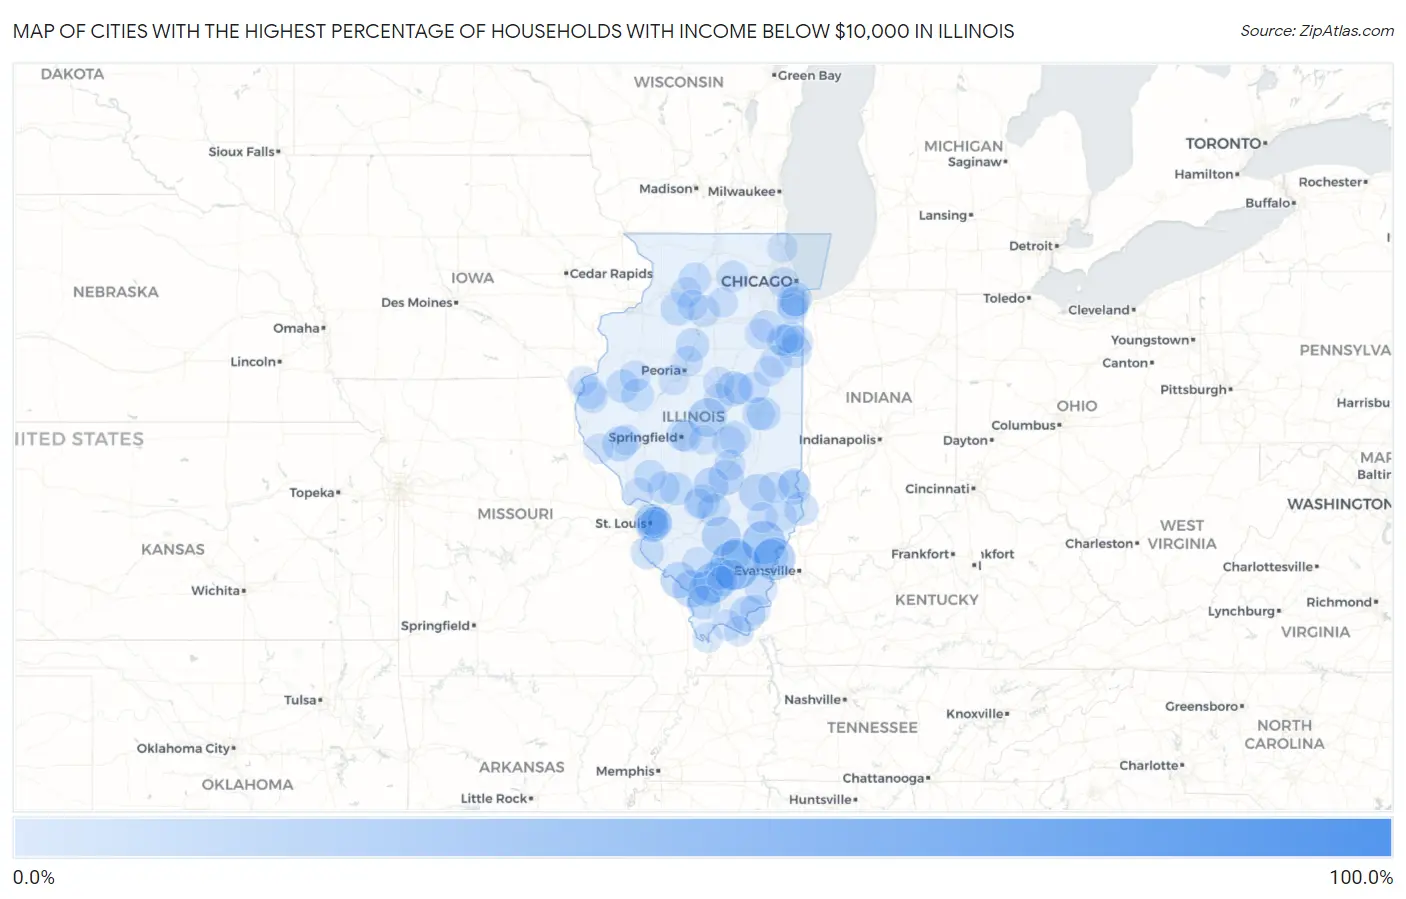
Map of Cities with the Highest Percentage of Households with Income Below $10,000 in Illinois
0.0%
100.0%
Cities with the Highest Percentage of Households with Income Below $10,000 in Illinois
| City | Households with Income < $10k | vs State | vs National | |
| 1. | Janesville | 83.3% | 5.3%(+78.0)#1 | 4.9%(+78.4)#45 |
| 2. | Serena | 78.3% | 5.3%(+73.0)#2 | 4.9%(+73.4)#50 |
| 3. | Riggston | 55.6% | 5.3%(+50.3)#3 | 4.9%(+50.7)#130 |
| 4. | Lowpoint | 45.8% | 5.3%(+40.5)#4 | 4.9%(+40.9)#213 |
| 5. | Niota | 44.4% | 5.3%(+39.1)#5 | 4.9%(+39.5)#232 |
| 6. | Macedonia | 37.5% | 5.3%(+32.2)#6 | 4.9%(+32.6)#340 |
| 7. | Golden Gate | 29.3% | 5.3%(+24.0)#7 | 4.9%(+24.4)#586 |
| 8. | Phillipstown | 28.6% | 5.3%(+23.3)#8 | 4.9%(+23.7)#619 |
| 9. | Colp | 25.5% | 5.3%(+20.2)#9 | 4.9%(+20.6)#762 |
| 10. | Dix | 23.5% | 5.3%(+18.2)#10 | 4.9%(+18.6)#891 |
| 11. | Chestnut | 23.1% | 5.3%(+17.8)#11 | 4.9%(+18.2)#925 |
| 12. | Gorham | 21.2% | 5.3%(+15.9)#12 | 4.9%(+16.3)#1,094 |
| 13. | Wheeler | 20.9% | 5.3%(+15.6)#13 | 4.9%(+16.0)#1,117 |
| 14. | Dewey | 20.7% | 5.3%(+15.4)#14 | 4.9%(+15.8)#1,138 |
| 15. | Rockwood | 20.0% | 5.3%(+14.7)#15 | 4.9%(+15.1)#1,227 |
| 16. | Golconda | 19.1% | 5.3%(+13.8)#16 | 4.9%(+14.2)#1,329 |
| 17. | Cowden | 18.8% | 5.3%(+13.5)#17 | 4.9%(+13.9)#1,378 |
| 18. | Carbondale | 18.5% | 5.3%(+13.2)#18 | 4.9%(+13.6)#1,413 |
| 19. | Ramsey | 18.5% | 5.3%(+13.2)#19 | 4.9%(+13.6)#1,415 |
| 20. | Griggsville | 18.2% | 5.3%(+12.9)#20 | 4.9%(+13.3)#1,453 |
| 21. | Ellsworth | 18.2% | 5.3%(+12.9)#21 | 4.9%(+13.3)#1,463 |
| 22. | Brooklyn | 17.6% | 5.3%(+12.3)#22 | 4.9%(+12.7)#1,547 |
| 23. | Riverdale | 17.1% | 5.3%(+11.8)#23 | 4.9%(+12.2)#1,619 |
| 24. | East St Louis | 17.0% | 5.3%(+11.7)#24 | 4.9%(+12.1)#1,635 |
| 25. | Mulberry Grove | 17.0% | 5.3%(+11.7)#25 | 4.9%(+12.1)#1,644 |
| 26. | Hutsonville | 17.0% | 5.3%(+11.7)#26 | 4.9%(+12.1)#1,645 |
| 27. | Crossville | 16.8% | 5.3%(+11.5)#27 | 4.9%(+11.9)#1,695 |
| 28. | Cobden | 16.7% | 5.3%(+11.4)#28 | 4.9%(+11.8)#1,711 |
| 29. | Russellville | 16.7% | 5.3%(+11.4)#29 | 4.9%(+11.8)#1,735 |
| 30. | New Bedford | 16.7% | 5.3%(+11.4)#30 | 4.9%(+11.8)#1,741 |
| 31. | Urbana | 16.4% | 5.3%(+11.1)#31 | 4.9%(+11.5)#1,780 |
| 32. | Sparland | 16.1% | 5.3%(+10.8)#32 | 4.9%(+11.2)#1,852 |
| 33. | Maeystown | 16.0% | 5.3%(+10.7)#33 | 4.9%(+11.1)#1,872 |
| 34. | Macomb | 15.9% | 5.3%(+10.6)#34 | 4.9%(+11.0)#1,875 |
| 35. | Beaverville | 15.8% | 5.3%(+10.5)#35 | 4.9%(+10.9)#1,909 |
| 36. | Lake Ka Ho | 15.8% | 5.3%(+10.5)#36 | 4.9%(+10.9)#1,911 |
| 37. | Aroma Park | 15.4% | 5.3%(+10.1)#37 | 4.9%(+10.5)#2,003 |
| 38. | Dalton City | 15.4% | 5.3%(+10.1)#38 | 4.9%(+10.5)#2,004 |
| 39. | Vernon | 15.4% | 5.3%(+10.1)#39 | 4.9%(+10.5)#2,015 |
| 40. | Table Grove | 15.1% | 5.3%(+9.80)#40 | 4.9%(+10.2)#2,070 |
| 41. | Laplace | 15.1% | 5.3%(+9.80)#41 | 4.9%(+10.2)#2,076 |
| 42. | Champaign | 15.0% | 5.3%(+9.70)#42 | 4.9%(+10.1)#2,078 |
| 43. | Grand Detour | 14.9% | 5.3%(+9.60)#43 | 4.9%(+10.00)#2,128 |
| 44. | Royal Lakes | 14.9% | 5.3%(+9.60)#44 | 4.9%(+10.00)#2,129 |
| 45. | Galt | 14.8% | 5.3%(+9.50)#45 | 4.9%(+9.90)#2,166 |
| 46. | Sauget | 14.7% | 5.3%(+9.40)#46 | 4.9%(+9.80)#2,192 |
| 47. | Rockbridge | 14.7% | 5.3%(+9.40)#47 | 4.9%(+9.80)#2,200 |
| 48. | Elvaston | 14.5% | 5.3%(+9.20)#48 | 4.9%(+9.60)#2,241 |
| 49. | Danforth | 14.4% | 5.3%(+9.10)#49 | 4.9%(+9.50)#2,253 |
| 50. | Hazel Crest | 14.3% | 5.3%(+9.00)#50 | 4.9%(+9.40)#2,261 |
| 51. | Junction | 14.3% | 5.3%(+9.00)#51 | 4.9%(+9.40)#2,294 |
| 52. | Grandview | 14.2% | 5.3%(+8.90)#52 | 4.9%(+9.30)#2,309 |
| 53. | Orient | 14.2% | 5.3%(+8.90)#53 | 4.9%(+9.30)#2,317 |
| 54. | Clear Lake | 14.1% | 5.3%(+8.80)#54 | 4.9%(+9.20)#2,341 |
| 55. | Lakewood Shores | 14.0% | 5.3%(+8.70)#55 | 4.9%(+9.10)#2,368 |
| 56. | Arlington | 13.9% | 5.3%(+8.60)#56 | 4.9%(+9.00)#2,405 |
| 57. | Dekalb | 13.6% | 5.3%(+8.30)#57 | 4.9%(+8.70)#2,470 |
| 58. | Venice | 13.6% | 5.3%(+8.30)#58 | 4.9%(+8.70)#2,479 |
| 59. | Dahlgren | 13.6% | 5.3%(+8.30)#59 | 4.9%(+8.70)#2,488 |
| 60. | Kankakee | 13.5% | 5.3%(+8.20)#60 | 4.9%(+8.60)#2,505 |
| 61. | Hopkins Park | 13.3% | 5.3%(+8.00)#61 | 4.9%(+8.40)#2,594 |
| 62. | Washington Park | 13.2% | 5.3%(+7.90)#62 | 4.9%(+8.30)#2,630 |
| 63. | Sun River Terrace | 13.2% | 5.3%(+7.90)#63 | 4.9%(+8.30)#2,639 |
| 64. | Prairie City | 13.2% | 5.3%(+7.90)#64 | 4.9%(+8.30)#2,643 |
| 65. | Normal | 13.1% | 5.3%(+7.80)#65 | 4.9%(+8.20)#2,653 |
| 66. | Gibson City | 13.1% | 5.3%(+7.80)#66 | 4.9%(+8.20)#2,660 |
| 67. | Sumner | 13.1% | 5.3%(+7.80)#67 | 4.9%(+8.20)#2,664 |
| 68. | Joppa | 13.1% | 5.3%(+7.80)#68 | 4.9%(+8.20)#2,684 |
| 69. | Naples | 13.0% | 5.3%(+7.70)#69 | 4.9%(+8.10)#2,725 |
| 70. | Broadview | 12.9% | 5.3%(+7.60)#70 | 4.9%(+8.00)#2,736 |
| 71. | Thompsonville | 12.8% | 5.3%(+7.50)#71 | 4.9%(+7.90)#2,797 |
| 72. | Spring Bay | 12.8% | 5.3%(+7.50)#72 | 4.9%(+7.90)#2,799 |
| 73. | Yale | 12.8% | 5.3%(+7.50)#73 | 4.9%(+7.90)#2,810 |
| 74. | Shelbyville | 12.7% | 5.3%(+7.40)#74 | 4.9%(+7.80)#2,816 |
| 75. | Olympia Fields | 12.6% | 5.3%(+7.30)#75 | 4.9%(+7.70)#2,851 |
| 76. | Pinckneyville | 12.5% | 5.3%(+7.20)#76 | 4.9%(+7.60)#2,896 |
| 77. | Noble | 12.5% | 5.3%(+7.20)#77 | 4.9%(+7.60)#2,919 |
| 78. | Basco | 12.5% | 5.3%(+7.20)#78 | 4.9%(+7.60)#2,941 |
| 79. | Harmon | 12.5% | 5.3%(+7.20)#79 | 4.9%(+7.60)#2,942 |
| 80. | Heyworth | 12.4% | 5.3%(+7.10)#80 | 4.9%(+7.50)#2,968 |
| 81. | Rosiclare | 12.4% | 5.3%(+7.10)#81 | 4.9%(+7.50)#2,980 |
| 82. | Ohio | 12.4% | 5.3%(+7.10)#82 | 4.9%(+7.50)#2,987 |
| 83. | Arrowsmith | 12.4% | 5.3%(+7.10)#83 | 4.9%(+7.50)#2,994 |
| 84. | Earlville | 12.2% | 5.3%(+6.90)#84 | 4.9%(+7.30)#3,062 |
| 85. | Nauvoo | 12.2% | 5.3%(+6.90)#85 | 4.9%(+7.30)#3,070 |
| 86. | Thawville | 12.2% | 5.3%(+6.90)#86 | 4.9%(+7.30)#3,084 |
| 87. | West York | 12.1% | 5.3%(+6.80)#87 | 4.9%(+7.20)#3,136 |
| 88. | East Brooklyn | 12.1% | 5.3%(+6.80)#88 | 4.9%(+7.20)#3,141 |
| 89. | Brookport | 12.0% | 5.3%(+6.70)#89 | 4.9%(+7.10)#3,170 |
| 90. | Smithboro | 12.0% | 5.3%(+6.70)#90 | 4.9%(+7.10)#3,187 |
| 91. | Kingston Mines | 12.0% | 5.3%(+6.70)#91 | 4.9%(+7.10)#3,189 |
| 92. | Unity | 12.0% | 5.3%(+6.70)#92 | 4.9%(+7.10)#3,195 |
| 93. | Cairo | 11.9% | 5.3%(+6.60)#93 | 4.9%(+7.00)#3,220 |
| 94. | Lawrence | 11.9% | 5.3%(+6.60)#94 | 4.9%(+7.00)#3,251 |
| 95. | Harvey | 11.8% | 5.3%(+6.50)#95 | 4.9%(+6.90)#3,263 |
| 96. | Johnston City | 11.8% | 5.3%(+6.50)#96 | 4.9%(+6.90)#3,274 |
| 97. | North Chicago | 11.7% | 5.3%(+6.40)#97 | 4.9%(+6.80)#3,317 |
| 98. | New Canton | 11.7% | 5.3%(+6.40)#98 | 4.9%(+6.80)#3,356 |
| 99. | Otterville | 11.6% | 5.3%(+6.30)#99 | 4.9%(+6.70)#3,418 |
| 100. | Mount Auburn | 11.5% | 5.3%(+6.20)#100 | 4.9%(+6.60)#3,455 |
Common Questions
What are the Top 10 Cities with the Highest Percentage of Households with Income Below $10,000 in Illinois?
Top 10 Cities with the Highest Percentage of Households with Income Below $10,000 in Illinois are:
#1
37.5%
#2
29.3%
#3
28.6%
#4
25.5%
#5
23.5%
#6
23.1%
#7
21.2%
#8
20.9%
#9
20.0%
#10
19.1%
What city has the Highest Percentage of Households with Income Below $10,000 in Illinois?
Macedonia has the Highest Percentage of Households with Income Below $10,000 in Illinois with 37.5%.
What is the Percentage of Households with Income Below $10,000 in the State of Illinois?
Percentage of Households with Income Below $10,000 in Illinois is 5.3%.
What is the Percentage of Households with Income Below $10,000 in the United States?
Percentage of Households with Income Below $10,000 in the United States is 4.9%.