Cities with the Highest Percentage of Households with Income Below $10,000 in Virginia
RELATED REPORTS & OPTIONS
Household Income | $0-10k
Virginia
Compare Cities
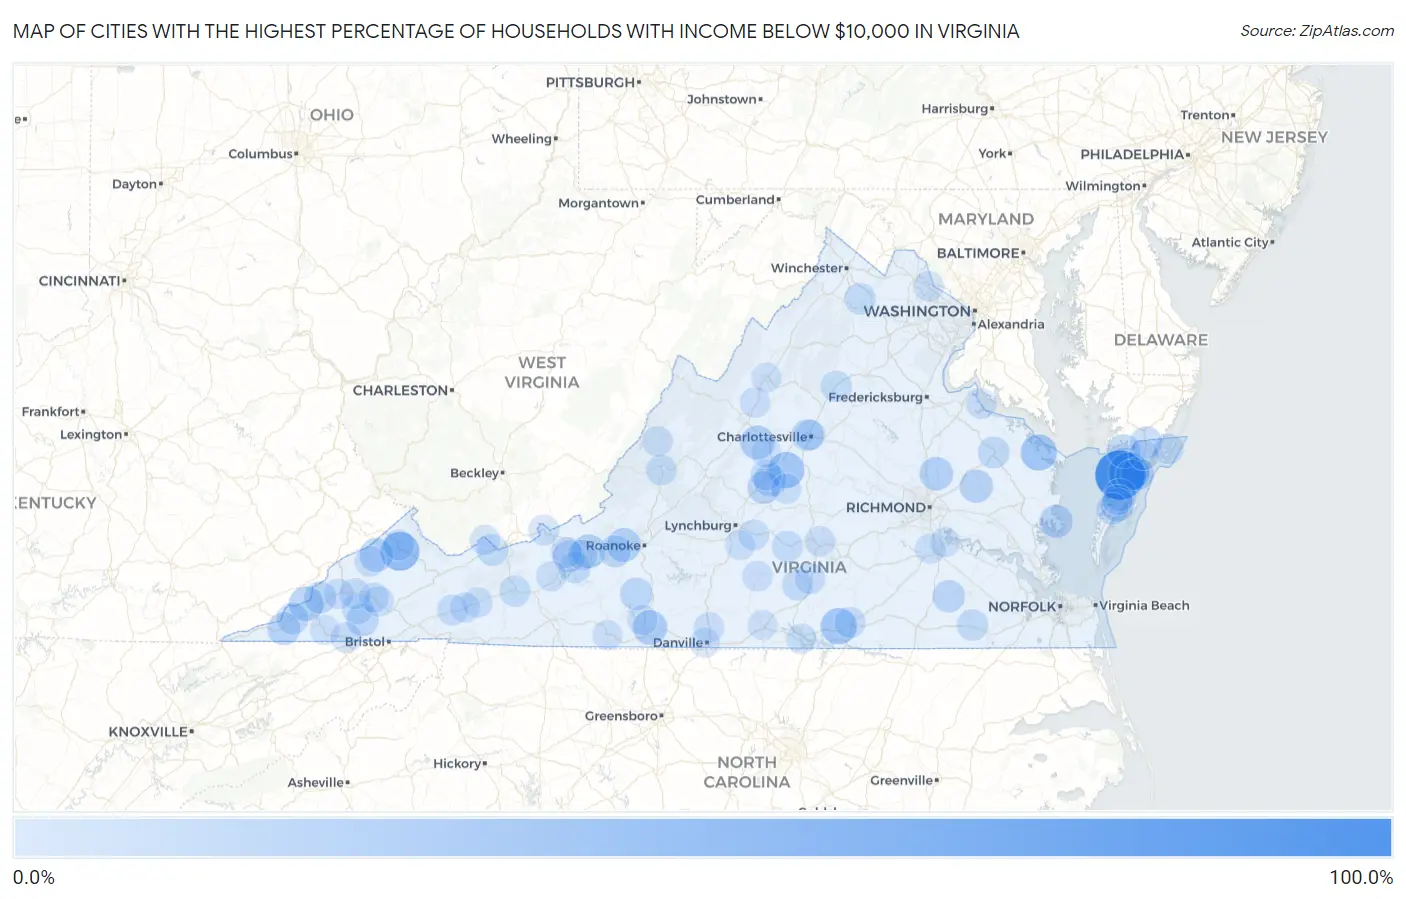
Map of Cities with the Highest Percentage of Households with Income Below $10,000 in Virginia
0.0%
100.0%
Cities with the Highest Percentage of Households with Income Below $10,000 in Virginia
| City | Households with Income < $10k | vs State | vs National | |
| 1. | Deep Creek | 100.0% | 4.2%(+95.8)#1 | 4.9%(+95.1)#15 |
| 2. | Rectortown | 73.5% | 4.2%(+69.3)#2 | 4.9%(+68.6)#61 |
| 3. | Locust Mount | 64.6% | 4.2%(+60.4)#3 | 4.9%(+59.7)#87 |
| 4. | Lee Mont | 55.8% | 4.2%(+51.6)#4 | 4.9%(+50.9)#128 |
| 5. | Vansant | 49.0% | 4.2%(+44.8)#5 | 4.9%(+44.1)#177 |
| 6. | The University Of Virginia's College At Wise | 48.0% | 4.2%(+43.8)#6 | 4.9%(+43.1)#185 |
| 7. | Cliftondale Park | 45.1% | 4.2%(+40.9)#7 | 4.9%(+40.2)#222 |
| 8. | Schuyler | 36.4% | 4.2%(+32.2)#8 | 4.9%(+31.5)#361 |
| 9. | Union Level | 36.4% | 4.2%(+32.2)#9 | 4.9%(+31.5)#365 |
| 10. | Heathsville | 36.2% | 4.2%(+32.0)#10 | 4.9%(+31.3)#371 |
| 11. | Kincora | 35.6% | 4.2%(+31.4)#11 | 4.9%(+30.7)#385 |
| 12. | Keokee | 29.5% | 4.2%(+25.3)#12 | 4.9%(+24.6)#579 |
| 13. | Villa Heights | 28.9% | 4.2%(+24.7)#13 | 4.9%(+24.0)#597 |
| 14. | Sherando | 26.9% | 4.2%(+22.7)#14 | 4.9%(+22.0)#693 |
| 15. | Glenvar | 25.5% | 4.2%(+21.3)#15 | 4.9%(+20.6)#759 |
| 16. | Blacksburg | 25.0% | 4.2%(+20.8)#16 | 4.9%(+20.1)#780 |
| 17. | Haysi | 25.0% | 4.2%(+20.8)#17 | 4.9%(+20.1)#785 |
| 18. | Hanover | 25.0% | 4.2%(+20.8)#18 | 4.9%(+20.1)#791 |
| 19. | Saxis | 24.6% | 4.2%(+20.4)#19 | 4.9%(+19.7)#826 |
| 20. | King William | 23.3% | 4.2%(+19.1)#20 | 4.9%(+18.4)#910 |
| 21. | Cats Bridge | 23.2% | 4.2%(+19.0)#21 | 4.9%(+18.3)#919 |
| 22. | Mathews | 22.0% | 4.2%(+17.8)#22 | 4.9%(+17.1)#1,016 |
| 23. | Afton | 21.7% | 4.2%(+17.5)#23 | 4.9%(+16.8)#1,037 |
| 24. | Osaka | 21.7% | 4.2%(+17.5)#24 | 4.9%(+16.8)#1,039 |
| 25. | Metompkin | 21.4% | 4.2%(+17.2)#25 | 4.9%(+16.5)#1,072 |
| 26. | Fairfield | 21.3% | 4.2%(+17.1)#26 | 4.9%(+16.4)#1,082 |
| 27. | Jonesville | 21.1% | 4.2%(+16.9)#27 | 4.9%(+16.2)#1,101 |
| 28. | Shipman | 20.7% | 4.2%(+16.5)#28 | 4.9%(+15.8)#1,134 |
| 29. | Arrington | 20.6% | 4.2%(+16.4)#29 | 4.9%(+15.7)#1,141 |
| 30. | Keller | 20.2% | 4.2%(+16.0)#30 | 4.9%(+15.3)#1,175 |
| 31. | Ferrum | 19.9% | 4.2%(+15.7)#31 | 4.9%(+15.0)#1,232 |
| 32. | Sussex | 19.3% | 4.2%(+15.1)#32 | 4.9%(+14.4)#1,307 |
| 33. | Barboursville | 19.2% | 4.2%(+15.0)#33 | 4.9%(+14.3)#1,315 |
| 34. | Big Rock | 19.0% | 4.2%(+14.8)#34 | 4.9%(+14.1)#1,350 |
| 35. | Nickelsville | 18.8% | 4.2%(+14.6)#35 | 4.9%(+13.9)#1,380 |
| 36. | New Church | 18.3% | 4.2%(+14.1)#36 | 4.9%(+13.4)#1,444 |
| 37. | Appalachia | 18.1% | 4.2%(+13.9)#37 | 4.9%(+13.2)#1,474 |
| 38. | Belspring | 17.5% | 4.2%(+13.3)#38 | 4.9%(+12.6)#1,570 |
| 39. | University Of Virginia | 17.4% | 4.2%(+13.2)#39 | 4.9%(+12.5)#1,571 |
| 40. | Lafayette | 17.3% | 4.2%(+13.1)#40 | 4.9%(+12.4)#1,595 |
| 41. | Pennington Gap | 17.2% | 4.2%(+13.0)#41 | 4.9%(+12.3)#1,607 |
| 42. | Tappahannock | 16.1% | 4.2%(+11.9)#42 | 4.9%(+11.2)#1,840 |
| 43. | Exmore | 15.7% | 4.2%(+11.5)#43 | 4.9%(+10.8)#1,923 |
| 44. | Radford | 15.5% | 4.2%(+11.3)#44 | 4.9%(+10.6)#1,967 |
| 45. | Bluefield | 15.3% | 4.2%(+11.1)#45 | 4.9%(+10.4)#2,021 |
| 46. | Courtland | 15.3% | 4.2%(+11.1)#46 | 4.9%(+10.4)#2,026 |
| 47. | Shenandoah Farms | 14.8% | 4.2%(+10.6)#47 | 4.9%(+9.90)#2,144 |
| 48. | Pamplin City | 14.3% | 4.2%(+10.1)#48 | 4.9%(+9.40)#2,292 |
| 49. | Wytheville | 14.1% | 4.2%(+9.90)#49 | 4.9%(+9.20)#2,322 |
| 50. | South Hill | 13.9% | 4.2%(+9.70)#50 | 4.9%(+9.00)#2,385 |
| 51. | Tacoma | 13.6% | 4.2%(+9.40)#51 | 4.9%(+8.70)#2,497 |
| 52. | Dungannon | 13.3% | 4.2%(+9.10)#52 | 4.9%(+8.40)#2,601 |
| 53. | Seven Mile Ford | 12.9% | 4.2%(+8.70)#53 | 4.9%(+8.00)#2,763 |
| 54. | Madison | 12.9% | 4.2%(+8.70)#54 | 4.9%(+8.00)#2,767 |
| 55. | Drakes Branch | 12.8% | 4.2%(+8.60)#55 | 4.9%(+7.90)#2,798 |
| 56. | Parrott | 12.7% | 4.2%(+8.50)#56 | 4.9%(+7.80)#2,835 |
| 57. | Riverview | 12.6% | 4.2%(+8.40)#57 | 4.9%(+7.70)#2,867 |
| 58. | Lovingston | 12.6% | 4.2%(+8.40)#58 | 4.9%(+7.70)#2,871 |
| 59. | Rich Creek | 12.4% | 4.2%(+8.20)#59 | 4.9%(+7.50)#2,984 |
| 60. | Concord | 12.0% | 4.2%(+7.80)#60 | 4.9%(+7.10)#3,167 |
| 61. | Grundy | 11.7% | 4.2%(+7.50)#61 | 4.9%(+6.80)#3,340 |
| 62. | Chase Crossing | 11.7% | 4.2%(+7.50)#62 | 4.9%(+6.80)#3,349 |
| 63. | Iron Gate | 11.7% | 4.2%(+7.50)#63 | 4.9%(+6.80)#3,353 |
| 64. | Keysville | 11.6% | 4.2%(+7.40)#64 | 4.9%(+6.70)#3,394 |
| 65. | Weber City | 11.5% | 4.2%(+7.30)#65 | 4.9%(+6.60)#3,441 |
| 66. | Farmville | 11.1% | 4.2%(+6.90)#66 | 4.9%(+6.20)#3,640 |
| 67. | Colonial Beach | 11.0% | 4.2%(+6.80)#67 | 4.9%(+6.10)#3,714 |
| 68. | Blairs | 11.0% | 4.2%(+6.80)#68 | 4.9%(+6.10)#3,731 |
| 69. | Charlottesville | 10.9% | 4.2%(+6.70)#69 | 4.9%(+6.00)#3,759 |
| 70. | Norton | 10.8% | 4.2%(+6.60)#70 | 4.9%(+5.90)#3,853 |
| 71. | Brookneal | 10.8% | 4.2%(+6.60)#71 | 4.9%(+5.90)#3,868 |
| 72. | Mcgaheysville | 10.7% | 4.2%(+6.50)#72 | 4.9%(+5.80)#3,931 |
| 73. | Chincoteague | 10.6% | 4.2%(+6.40)#73 | 4.9%(+5.70)#3,984 |
| 74. | Mount Sidney | 10.6% | 4.2%(+6.40)#74 | 4.9%(+5.70)#4,004 |
| 75. | Clinchco | 10.5% | 4.2%(+6.30)#75 | 4.9%(+5.60)#4,074 |
| 76. | Castlewood | 10.4% | 4.2%(+6.20)#76 | 4.9%(+5.50)#4,112 |
| 77. | Hot Springs | 10.3% | 4.2%(+6.10)#77 | 4.9%(+5.40)#4,199 |
| 78. | Pocahontas | 10.3% | 4.2%(+6.10)#78 | 4.9%(+5.40)#4,220 |
| 79. | University Center | 10.2% | 4.2%(+6.00)#79 | 4.9%(+5.30)#4,253 |
| 80. | Prices Fork | 10.2% | 4.2%(+6.00)#80 | 4.9%(+5.30)#4,276 |
| 81. | Clarksville | 10.0% | 4.2%(+5.80)#81 | 4.9%(+5.10)#4,387 |
| 82. | Stanleytown | 10.0% | 4.2%(+5.80)#82 | 4.9%(+5.10)#4,389 |
| 83. | Atkins | 10.0% | 4.2%(+5.80)#83 | 4.9%(+5.10)#4,394 |
| 84. | Pulaski | 9.9% | 4.2%(+5.70)#84 | 4.9%(+5.00)#4,440 |
| 85. | Painter | 9.9% | 4.2%(+5.70)#85 | 4.9%(+5.00)#4,503 |
| 86. | Yogaville | 9.9% | 4.2%(+5.70)#86 | 4.9%(+5.00)#4,509 |
| 87. | Marion | 9.7% | 4.2%(+5.50)#87 | 4.9%(+4.80)#4,608 |
| 88. | Rustburg | 9.6% | 4.2%(+5.40)#88 | 4.9%(+4.70)#4,704 |
| 89. | Ettrick | 9.5% | 4.2%(+5.30)#89 | 4.9%(+4.60)#4,760 |
| 90. | Stuart | 9.5% | 4.2%(+5.30)#90 | 4.9%(+4.60)#4,776 |
| 91. | Allison Gap | 9.5% | 4.2%(+5.30)#91 | 4.9%(+4.60)#4,790 |
| 92. | Stevens Creek | 9.5% | 4.2%(+5.30)#92 | 4.9%(+4.60)#4,824 |
| 93. | Clinchport | 9.5% | 4.2%(+5.30)#93 | 4.9%(+4.60)#4,828 |
| 94. | Harrisonburg | 9.4% | 4.2%(+5.20)#94 | 4.9%(+4.50)#4,838 |
| 95. | Danville | 9.4% | 4.2%(+5.20)#95 | 4.9%(+4.50)#4,839 |
| 96. | St Paul | 9.4% | 4.2%(+5.20)#96 | 4.9%(+4.50)#4,871 |
| 97. | Nellysford | 9.3% | 4.2%(+5.10)#97 | 4.9%(+4.40)#4,958 |
| 98. | Temperanceville | 9.3% | 4.2%(+5.10)#98 | 4.9%(+4.40)#4,994 |
| 99. | Hopewell | 9.1% | 4.2%(+4.90)#99 | 4.9%(+4.20)#5,101 |
| 100. | South Boston | 9.0% | 4.2%(+4.80)#100 | 4.9%(+4.10)#5,217 |
Common Questions
What are the Top 10 Cities with the Highest Percentage of Households with Income Below $10,000 in Virginia?
Top 10 Cities with the Highest Percentage of Households with Income Below $10,000 in Virginia are:
#1
100.0%
#2
55.8%
#3
49.0%
#4
36.4%
#5
36.4%
#6
36.2%
#7
29.5%
#8
28.9%
#9
26.9%
#10
25.5%
What city has the Highest Percentage of Households with Income Below $10,000 in Virginia?
Deep Creek has the Highest Percentage of Households with Income Below $10,000 in Virginia with 100.0%.
What is the Percentage of Households with Income Below $10,000 in the State of Virginia?
Percentage of Households with Income Below $10,000 in Virginia is 4.2%.
What is the Percentage of Households with Income Below $10,000 in the United States?
Percentage of Households with Income Below $10,000 in the United States is 4.9%.