Cities with the Highest Percentage of Households with Income Below $10,000 in Mississippi
RELATED REPORTS & OPTIONS
Household Income | $0-10k
Mississippi
Compare Cities
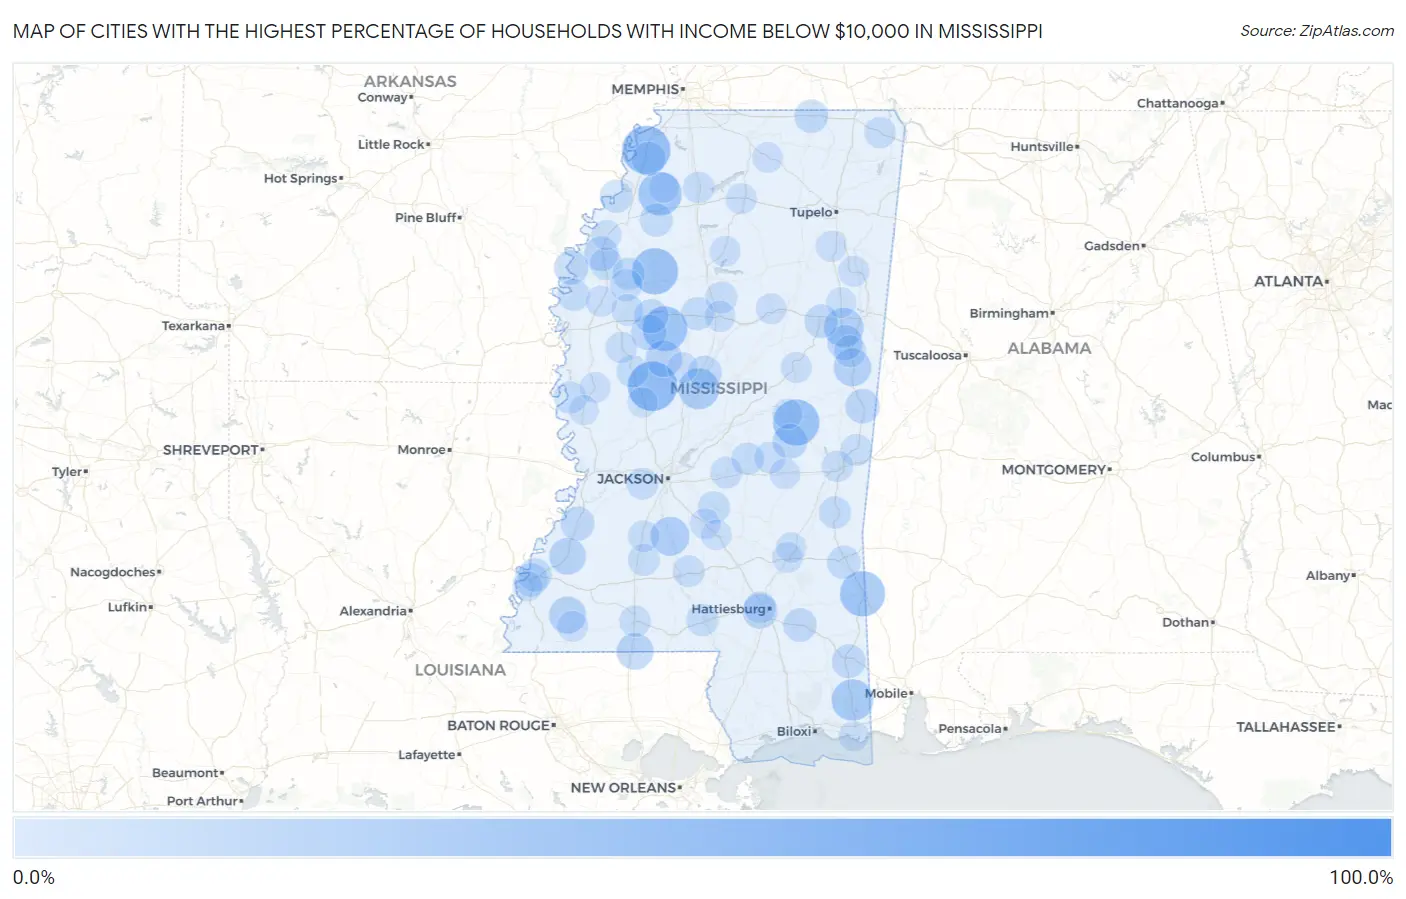
Map of Cities with the Highest Percentage of Households with Income Below $10,000 in Mississippi
0.0%
100.0%
Cities with the Highest Percentage of Households with Income Below $10,000 in Mississippi
| City | Households with Income < $10k | vs State | vs National | |
| 1. | Symonds | 100.0% | 7.4%(+92.6)#1 | 4.9%(+95.1)#21 |
| 2. | Panther Burn | 61.9% | 7.4%(+54.5)#2 | 4.9%(+57.0)#97 |
| 3. | Eden | 50.0% | 7.4%(+42.6)#3 | 4.9%(+45.1)#163 |
| 4. | North Tunica | 47.7% | 7.4%(+40.3)#4 | 4.9%(+42.8)#190 |
| 5. | Dennis | 47.6% | 7.4%(+40.2)#5 | 4.9%(+42.7)#192 |
| 6. | Stewart | 45.3% | 7.4%(+37.9)#6 | 4.9%(+40.4)#218 |
| 7. | Tucker | 43.5% | 7.4%(+36.1)#7 | 4.9%(+38.6)#244 |
| 8. | Glendora | 43.4% | 7.4%(+36.0)#8 | 4.9%(+38.5)#247 |
| 9. | State Line | 41.4% | 7.4%(+34.0)#9 | 4.9%(+36.5)#274 |
| 10. | Sidon | 40.6% | 7.4%(+33.2)#10 | 4.9%(+35.7)#285 |
| 11. | Falcon | 38.2% | 7.4%(+30.8)#11 | 4.9%(+33.3)#330 |
| 12. | Eagle Bend | 35.2% | 7.4%(+27.8)#12 | 4.9%(+30.3)#397 |
| 13. | Wade | 34.2% | 7.4%(+26.8)#13 | 4.9%(+29.3)#420 |
| 14. | Goodman | 32.9% | 7.4%(+25.5)#14 | 4.9%(+28.0)#464 |
| 15. | Artesia | 30.0% | 7.4%(+22.6)#15 | 4.9%(+25.1)#547 |
| 16. | De Soto | 30.0% | 7.4%(+22.6)#16 | 4.9%(+25.1)#548 |
| 17. | Georgetown | 28.8% | 7.4%(+21.4)#17 | 4.9%(+23.9)#607 |
| 18. | Macon | 26.5% | 7.4%(+19.1)#18 | 4.9%(+21.6)#706 |
| 19. | Crosby | 25.3% | 7.4%(+17.9)#19 | 4.9%(+20.4)#772 |
| 20. | Fayette | 25.0% | 7.4%(+17.6)#20 | 4.9%(+20.1)#782 |
| 21. | Glen Allan | 25.0% | 7.4%(+17.6)#21 | 4.9%(+20.1)#786 |
| 22. | Tchula | 24.6% | 7.4%(+17.2)#22 | 4.9%(+19.7)#819 |
| 23. | Osyka | 24.5% | 7.4%(+17.1)#23 | 4.9%(+19.6)#829 |
| 24. | Bethlehem | 23.4% | 7.4%(+16.0)#24 | 4.9%(+18.5)#900 |
| 25. | Morgan City | 22.4% | 7.4%(+15.0)#25 | 4.9%(+17.5)#984 |
| 26. | Crawford | 21.6% | 7.4%(+14.2)#26 | 4.9%(+16.7)#1,045 |
| 27. | West Hattiesburg | 21.3% | 7.4%(+13.9)#27 | 4.9%(+16.4)#1,077 |
| 28. | Union | 20.9% | 7.4%(+13.5)#28 | 4.9%(+16.0)#1,114 |
| 29. | Scooba | 20.2% | 7.4%(+12.8)#29 | 4.9%(+15.3)#1,172 |
| 30. | Shelby | 20.1% | 7.4%(+12.7)#30 | 4.9%(+15.2)#1,181 |
| 31. | Rosedale | 19.9% | 7.4%(+12.5)#31 | 4.9%(+15.0)#1,231 |
| 32. | Itta Bena | 19.8% | 7.4%(+12.4)#32 | 4.9%(+14.9)#1,238 |
| 33. | White Oak | 19.6% | 7.4%(+12.2)#33 | 4.9%(+14.7)#1,269 |
| 34. | Port Gibson | 19.4% | 7.4%(+12.0)#34 | 4.9%(+14.5)#1,285 |
| 35. | Winterville | 19.4% | 7.4%(+12.0)#35 | 4.9%(+14.5)#1,297 |
| 36. | Lucedale | 18.9% | 7.4%(+11.5)#36 | 4.9%(+14.0)#1,356 |
| 37. | Starkville | 18.6% | 7.4%(+11.2)#37 | 4.9%(+13.7)#1,399 |
| 38. | Durant | 18.6% | 7.4%(+11.2)#38 | 4.9%(+13.7)#1,402 |
| 39. | New Augusta | 18.6% | 7.4%(+11.2)#39 | 4.9%(+13.7)#1,408 |
| 40. | Walnut | 18.5% | 7.4%(+11.1)#40 | 4.9%(+13.6)#1,416 |
| 41. | Fernwood | 18.5% | 7.4%(+11.1)#41 | 4.9%(+13.6)#1,420 |
| 42. | Natchez | 18.3% | 7.4%(+10.9)#42 | 4.9%(+13.4)#1,435 |
| 43. | Waynesboro | 18.3% | 7.4%(+10.9)#43 | 4.9%(+13.4)#1,436 |
| 44. | Morgantown | 18.2% | 7.4%(+10.8)#44 | 4.9%(+13.3)#1,454 |
| 45. | Lambert | 17.6% | 7.4%(+10.2)#45 | 4.9%(+12.7)#1,545 |
| 46. | North Carrollton | 17.6% | 7.4%(+10.2)#46 | 4.9%(+12.7)#1,549 |
| 47. | Friars Point | 17.4% | 7.4%(+10.00)#47 | 4.9%(+12.5)#1,575 |
| 48. | Mound Bayou | 16.9% | 7.4%(+9.50)#48 | 4.9%(+12.0)#1,667 |
| 49. | Hillsboro | 16.3% | 7.4%(+8.90)#49 | 4.9%(+11.4)#1,804 |
| 50. | Foxworth | 16.3% | 7.4%(+8.90)#50 | 4.9%(+11.4)#1,806 |
| 51. | Puckett | 16.1% | 7.4%(+8.70)#51 | 4.9%(+11.2)#1,851 |
| 52. | Drew | 16.0% | 7.4%(+8.60)#52 | 4.9%(+11.1)#1,861 |
| 53. | Mayersville | 16.0% | 7.4%(+8.60)#53 | 4.9%(+11.1)#1,866 |
| 54. | Silver City | 16.0% | 7.4%(+8.60)#54 | 4.9%(+11.1)#1,867 |
| 55. | Ruleville | 15.9% | 7.4%(+8.50)#55 | 4.9%(+11.0)#1,878 |
| 56. | Quitman | 15.9% | 7.4%(+8.50)#56 | 4.9%(+11.0)#1,882 |
| 57. | Benoit | 15.7% | 7.4%(+8.30)#57 | 4.9%(+10.8)#1,935 |
| 58. | Bobo | 15.6% | 7.4%(+8.20)#58 | 4.9%(+10.7)#1,960 |
| 59. | Brooksville | 15.4% | 7.4%(+8.00)#59 | 4.9%(+10.5)#2,002 |
| 60. | Duck Hill | 15.3% | 7.4%(+7.90)#60 | 4.9%(+10.4)#2,030 |
| 61. | Raymond | 15.2% | 7.4%(+7.80)#61 | 4.9%(+10.3)#2,044 |
| 62. | Arnold Line | 15.2% | 7.4%(+7.80)#62 | 4.9%(+10.3)#2,046 |
| 63. | Lauderdale | 15.1% | 7.4%(+7.70)#63 | 4.9%(+10.2)#2,073 |
| 64. | Morton | 14.9% | 7.4%(+7.50)#64 | 4.9%(+10.00)#2,114 |
| 65. | Wesson | 14.9% | 7.4%(+7.50)#65 | 4.9%(+10.00)#2,118 |
| 66. | Sunflower | 14.8% | 7.4%(+7.40)#66 | 4.9%(+9.90)#2,152 |
| 67. | Silver Creek | 14.8% | 7.4%(+7.40)#67 | 4.9%(+9.90)#2,164 |
| 68. | Burnsville | 14.6% | 7.4%(+7.20)#68 | 4.9%(+9.70)#2,213 |
| 69. | Conehatta | 14.5% | 7.4%(+7.10)#69 | 4.9%(+9.60)#2,233 |
| 70. | Hazlehurst | 14.4% | 7.4%(+7.00)#70 | 4.9%(+9.50)#2,246 |
| 71. | Sardis | 14.3% | 7.4%(+6.90)#71 | 4.9%(+9.40)#2,264 |
| 72. | Isola | 14.3% | 7.4%(+6.90)#72 | 4.9%(+9.40)#2,272 |
| 73. | Meridian | 14.1% | 7.4%(+6.70)#73 | 4.9%(+9.20)#2,320 |
| 74. | Mccomb | 14.1% | 7.4%(+6.70)#74 | 4.9%(+9.20)#2,321 |
| 75. | Shaw | 13.7% | 7.4%(+6.30)#75 | 4.9%(+8.80)#2,455 |
| 76. | Benton | 13.7% | 7.4%(+6.30)#76 | 4.9%(+8.80)#2,465 |
| 77. | Oxford | 13.6% | 7.4%(+6.20)#77 | 4.9%(+8.70)#2,471 |
| 78. | Winona | 13.6% | 7.4%(+6.20)#78 | 4.9%(+8.70)#2,476 |
| 79. | Louisville | 13.5% | 7.4%(+6.10)#79 | 4.9%(+8.60)#2,508 |
| 80. | Gloster | 13.5% | 7.4%(+6.10)#80 | 4.9%(+8.60)#2,517 |
| 81. | Aberdeen | 13.4% | 7.4%(+6.00)#81 | 4.9%(+8.50)#2,537 |
| 82. | Coffeeville | 13.4% | 7.4%(+6.00)#82 | 4.9%(+8.50)#2,547 |
| 83. | Anguilla | 13.2% | 7.4%(+5.80)#83 | 4.9%(+8.30)#2,638 |
| 84. | Eupora | 13.1% | 7.4%(+5.70)#84 | 4.9%(+8.20)#2,666 |
| 85. | Okolona | 12.9% | 7.4%(+5.50)#85 | 4.9%(+8.00)#2,745 |
| 86. | Lexington | 12.9% | 7.4%(+5.50)#86 | 4.9%(+8.00)#2,755 |
| 87. | Laurel | 12.7% | 7.4%(+5.30)#87 | 4.9%(+7.80)#2,812 |
| 88. | Newton | 12.7% | 7.4%(+5.30)#88 | 4.9%(+7.80)#2,819 |
| 89. | Mendenhall | 12.6% | 7.4%(+5.20)#89 | 4.9%(+7.70)#2,855 |
| 90. | Potts Camp | 12.6% | 7.4%(+5.20)#90 | 4.9%(+7.70)#2,874 |
| 91. | Sharon | 12.5% | 7.4%(+5.10)#91 | 4.9%(+7.60)#2,906 |
| 92. | Pascagoula | 12.3% | 7.4%(+4.90)#92 | 4.9%(+7.40)#3,002 |
| 93. | Yazoo City | 12.3% | 7.4%(+4.90)#93 | 4.9%(+7.40)#3,005 |
| 94. | Magee | 12.3% | 7.4%(+4.90)#94 | 4.9%(+7.40)#3,009 |
| 95. | West Point | 12.1% | 7.4%(+4.70)#95 | 4.9%(+7.20)#3,099 |
| 96. | Philadelphia | 12.1% | 7.4%(+4.70)#96 | 4.9%(+7.20)#3,100 |
| 97. | Cloverdale | 12.1% | 7.4%(+4.70)#97 | 4.9%(+7.20)#3,132 |
| 98. | Sledge | 12.1% | 7.4%(+4.70)#98 | 4.9%(+7.20)#3,134 |
| 99. | Alligator | 12.0% | 7.4%(+4.60)#99 | 4.9%(+7.10)#3,186 |
| 100. | Cary | 11.8% | 7.4%(+4.40)#100 | 4.9%(+6.90)#3,297 |
Common Questions
What are the Top 10 Cities with the Highest Percentage of Households with Income Below $10,000 in Mississippi?
Top 10 Cities with the Highest Percentage of Households with Income Below $10,000 in Mississippi are:
#1
50.0%
#2
47.7%
#3
43.5%
#4
43.4%
#5
41.4%
#6
40.6%
#7
38.2%
#8
34.2%
#9
32.9%
#10
30.0%
What city has the Highest Percentage of Households with Income Below $10,000 in Mississippi?
Eden has the Highest Percentage of Households with Income Below $10,000 in Mississippi with 50.0%.
What is the Percentage of Households with Income Below $10,000 in the State of Mississippi?
Percentage of Households with Income Below $10,000 in Mississippi is 7.4%.
What is the Percentage of Households with Income Below $10,000 in the United States?
Percentage of Households with Income Below $10,000 in the United States is 4.9%.