Cities with the Highest Percentage of Households with Income Below $10,000 in Colorado
RELATED REPORTS & OPTIONS
Household Income | $0-10k
Colorado
Compare Cities
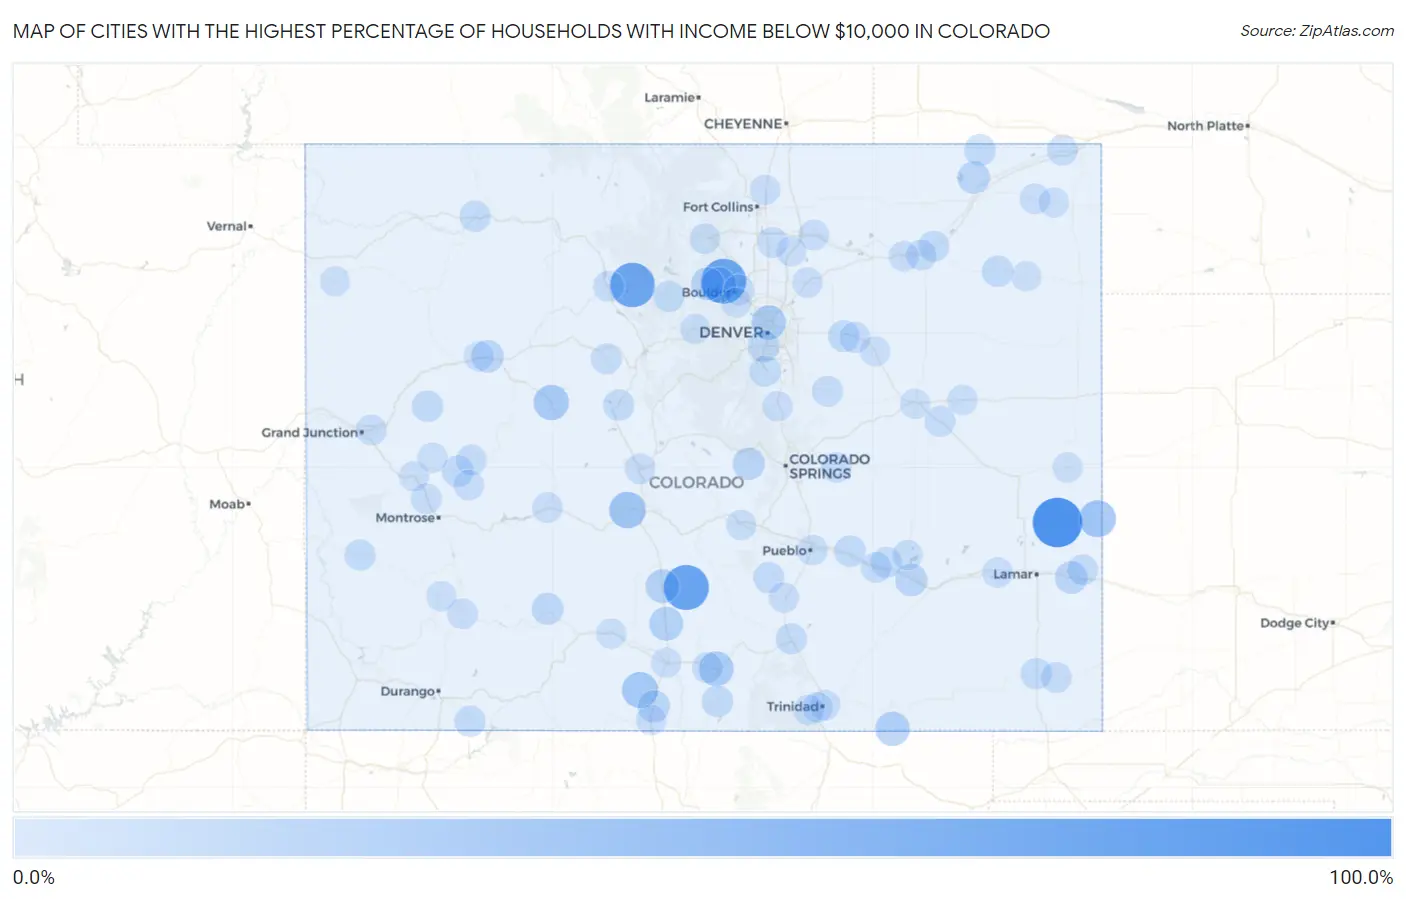
Map of Cities with the Highest Percentage of Households with Income Below $10,000 in Colorado
0.0%
100.0%
Cities with the Highest Percentage of Households with Income Below $10,000 in Colorado
| City | Households with Income < $10k | vs State | vs National | |
| 1. | Brandon | 100.0% | 3.9%(+96.1)#1 | 4.9%(+95.1)#22 |
| 2. | Crestone | 78.1% | 3.9%(+74.2)#2 | 4.9%(+73.2)#51 |
| 3. | Glendale | 76.4% | 3.9%(+72.5)#3 | 4.9%(+71.5)#53 |
| 4. | Parshall | 75.5% | 3.9%(+71.6)#4 | 4.9%(+70.6)#59 |
| 5. | Towner | 37.5% | 3.9%(+33.6)#5 | 4.9%(+32.6)#344 |
| 6. | Maysville | 35.8% | 3.9%(+31.9)#6 | 4.9%(+30.9)#380 |
| 7. | Somerset | 34.1% | 3.9%(+30.2)#7 | 4.9%(+29.2)#424 |
| 8. | Capulin | 33.3% | 3.9%(+29.4)#8 | 4.9%(+28.4)#442 |
| 9. | Gold Hill | 31.1% | 3.9%(+27.2)#9 | 4.9%(+26.2)#509 |
| 10. | Woody Creek | 29.8% | 3.9%(+25.9)#10 | 4.9%(+24.9)#564 |
| 11. | Fort Garland | 27.7% | 3.9%(+23.8)#11 | 4.9%(+22.8)#656 |
| 12. | North Washington | 26.0% | 3.9%(+22.1)#12 | 4.9%(+21.1)#741 |
| 13. | Branson | 25.0% | 3.9%(+21.1)#13 | 4.9%(+20.1)#798 |
| 14. | Hooper | 23.2% | 3.9%(+19.3)#14 | 4.9%(+18.3)#918 |
| 15. | Moffat | 22.6% | 3.9%(+18.7)#15 | 4.9%(+17.7)#968 |
| 16. | Ward | 18.8% | 3.9%(+14.9)#16 | 4.9%(+13.9)#1,390 |
| 17. | Granada | 17.1% | 3.9%(+13.2)#17 | 4.9%(+12.2)#1,629 |
| 18. | Rocky Ford | 17.0% | 3.9%(+13.1)#18 | 4.9%(+12.1)#1,636 |
| 19. | Chacra | 17.0% | 3.9%(+13.1)#19 | 4.9%(+12.1)#1,647 |
| 20. | Padroni | 16.7% | 3.9%(+12.8)#20 | 4.9%(+11.8)#1,744 |
| 21. | Twin Lakes Cdp Lake County | 16.6% | 3.9%(+12.7)#21 | 4.9%(+11.7)#1,761 |
| 22. | Midland | 15.6% | 3.9%(+11.7)#22 | 4.9%(+10.7)#1,953 |
| 23. | Romeo | 15.0% | 3.9%(+11.1)#23 | 4.9%(+10.1)#2,099 |
| 24. | City Of Creede | 14.8% | 3.9%(+10.9)#24 | 4.9%(+9.90)#2,162 |
| 25. | Cope | 14.3% | 3.9%(+10.4)#25 | 4.9%(+9.40)#2,297 |
| 26. | Sheridan | 13.8% | 3.9%(+9.90)#26 | 4.9%(+8.90)#2,415 |
| 27. | Hotchkiss | 13.3% | 3.9%(+9.40)#27 | 4.9%(+8.40)#2,584 |
| 28. | Collbran | 12.9% | 3.9%(+9.00)#28 | 4.9%(+8.00)#2,764 |
| 29. | Boone | 12.6% | 3.9%(+8.70)#29 | 4.9%(+7.70)#2,878 |
| 30. | Peetz | 12.6% | 3.9%(+8.70)#30 | 4.9%(+7.70)#2,881 |
| 31. | Strasburg | 12.5% | 3.9%(+8.60)#31 | 4.9%(+7.60)#2,901 |
| 32. | San Luis | 12.0% | 3.9%(+8.10)#32 | 4.9%(+7.10)#3,174 |
| 33. | Otis | 11.9% | 3.9%(+8.00)#33 | 4.9%(+7.00)#3,236 |
| 34. | Springfield | 11.4% | 3.9%(+7.50)#34 | 4.9%(+6.50)#3,500 |
| 35. | Louviers | 11.4% | 3.9%(+7.50)#35 | 4.9%(+6.50)#3,523 |
| 36. | Southern Ute | 11.1% | 3.9%(+7.20)#36 | 4.9%(+6.20)#3,681 |
| 37. | Tabernash | 11.0% | 3.9%(+7.10)#37 | 4.9%(+6.10)#3,739 |
| 38. | Olney Springs | 10.6% | 3.9%(+6.70)#38 | 4.9%(+5.70)#4,015 |
| 39. | Craig | 10.5% | 3.9%(+6.60)#39 | 4.9%(+5.60)#4,033 |
| 40. | Hillrose | 10.5% | 3.9%(+6.60)#40 | 4.9%(+5.60)#4,081 |
| 41. | Walsenburg | 10.4% | 3.9%(+6.50)#41 | 4.9%(+5.50)#4,100 |
| 42. | Naturita | 10.4% | 3.9%(+6.50)#42 | 4.9%(+5.50)#4,122 |
| 43. | Leadville | 10.3% | 3.9%(+6.40)#43 | 4.9%(+5.40)#4,164 |
| 44. | Beulah Valley | 10.3% | 3.9%(+6.40)#44 | 4.9%(+5.40)#4,188 |
| 45. | Kremmling | 10.2% | 3.9%(+6.30)#45 | 4.9%(+5.30)#4,266 |
| 46. | Byers | 10.2% | 3.9%(+6.30)#46 | 4.9%(+5.30)#4,268 |
| 47. | Boulder | 10.1% | 3.9%(+6.20)#47 | 4.9%(+5.20)#4,300 |
| 48. | Kiowa | 9.9% | 3.9%(+6.00)#48 | 4.9%(+5.00)#4,482 |
| 49. | Minturn | 9.8% | 3.9%(+5.90)#49 | 4.9%(+4.90)#4,558 |
| 50. | Hugo | 9.8% | 3.9%(+5.90)#50 | 4.9%(+4.90)#4,559 |
| 51. | Blanca | 9.8% | 3.9%(+5.90)#51 | 4.9%(+4.90)#4,576 |
| 52. | Olathe | 9.6% | 3.9%(+5.70)#52 | 4.9%(+4.70)#4,697 |
| 53. | Hartman | 9.5% | 3.9%(+5.60)#53 | 4.9%(+4.60)#4,831 |
| 54. | Vilas | 9.4% | 3.9%(+5.50)#54 | 4.9%(+4.50)#4,911 |
| 55. | Johnstown | 9.3% | 3.9%(+5.40)#55 | 4.9%(+4.40)#4,925 |
| 56. | Brush | 9.3% | 3.9%(+5.40)#56 | 4.9%(+4.40)#4,934 |
| 57. | Fowler | 9.2% | 3.9%(+5.30)#57 | 4.9%(+4.30)#5,056 |
| 58. | Ovid | 9.0% | 3.9%(+5.10)#58 | 4.9%(+4.10)#5,302 |
| 59. | Paonia | 8.9% | 3.9%(+5.00)#59 | 4.9%(+4.00)#5,362 |
| 60. | Clifton | 8.8% | 3.9%(+4.90)#60 | 4.9%(+3.90)#5,418 |
| 61. | Silverton | 8.6% | 3.9%(+4.70)#61 | 4.9%(+3.70)#5,714 |
| 62. | Trinidad | 8.5% | 3.9%(+4.60)#62 | 4.9%(+3.60)#5,765 |
| 63. | Kersey | 8.5% | 3.9%(+4.60)#63 | 4.9%(+3.60)#5,804 |
| 64. | Gunnison | 8.3% | 3.9%(+4.40)#64 | 4.9%(+3.40)#5,997 |
| 65. | Cokedale | 8.3% | 3.9%(+4.40)#65 | 4.9%(+3.40)#6,085 |
| 66. | Fort Morgan | 8.1% | 3.9%(+4.20)#66 | 4.9%(+3.20)#6,215 |
| 67. | Colorado City | 8.0% | 3.9%(+4.10)#67 | 4.9%(+3.10)#6,364 |
| 68. | Jansen | 8.0% | 3.9%(+4.10)#68 | 4.9%(+3.10)#6,425 |
| 69. | Hasty | 8.0% | 3.9%(+4.10)#69 | 4.9%(+3.10)#6,431 |
| 70. | Pueblo | 7.9% | 3.9%(+4.00)#70 | 4.9%(+3.00)#6,442 |
| 71. | Antonito | 7.9% | 3.9%(+4.00)#71 | 4.9%(+3.00)#6,536 |
| 72. | Park Center | 7.8% | 3.9%(+3.90)#72 | 4.9%(+2.90)#6,621 |
| 73. | Ellicott | 7.7% | 3.9%(+3.80)#73 | 4.9%(+2.80)#6,766 |
| 74. | Larkspur | 7.7% | 3.9%(+3.80)#74 | 4.9%(+2.80)#6,815 |
| 75. | Marvel | 7.7% | 3.9%(+3.80)#75 | 4.9%(+2.80)#6,830 |
| 76. | Haxtun | 7.6% | 3.9%(+3.70)#76 | 4.9%(+2.70)#6,941 |
| 77. | Crawford | 7.6% | 3.9%(+3.70)#77 | 4.9%(+2.70)#6,956 |
| 78. | Johnson Village | 7.6% | 3.9%(+3.70)#78 | 4.9%(+2.70)#6,969 |
| 79. | Estes Park | 7.5% | 3.9%(+3.60)#79 | 4.9%(+2.60)#7,028 |
| 80. | Ordway | 7.4% | 3.9%(+3.50)#80 | 4.9%(+2.50)#7,212 |
| 81. | Arriba | 7.3% | 3.9%(+3.40)#81 | 4.9%(+2.40)#7,415 |
| 82. | Lincoln Park | 7.2% | 3.9%(+3.30)#82 | 4.9%(+2.30)#7,480 |
| 83. | Hudson | 7.2% | 3.9%(+3.30)#83 | 4.9%(+2.30)#7,503 |
| 84. | Wellington | 7.1% | 3.9%(+3.20)#84 | 4.9%(+2.20)#7,615 |
| 85. | Canon City | 7.0% | 3.9%(+3.10)#85 | 4.9%(+2.10)#7,761 |
| 86. | Cheyenne Wells | 7.0% | 3.9%(+3.10)#86 | 4.9%(+2.10)#7,837 |
| 87. | New Castle | 6.9% | 3.9%(+3.00)#87 | 4.9%(+2.00)#7,929 |
| 88. | Del Norte | 6.9% | 3.9%(+3.00)#88 | 4.9%(+2.00)#7,961 |
| 89. | Alamosa | 6.8% | 3.9%(+2.90)#89 | 4.9%(+1.90)#8,083 |
| 90. | Rangely | 6.8% | 3.9%(+2.90)#90 | 4.9%(+1.90)#8,126 |
| 91. | Deer Trail | 6.8% | 3.9%(+2.90)#91 | 4.9%(+1.90)#8,168 |
| 92. | Downieville Lawson Dumont | 6.8% | 3.9%(+2.90)#92 | 4.9%(+1.90)#8,192 |
| 93. | Mountain Village | 6.7% | 3.9%(+2.80)#93 | 4.9%(+1.80)#8,303 |
| 94. | Delta | 6.6% | 3.9%(+2.70)#94 | 4.9%(+1.70)#8,408 |
| 95. | Eldorado Springs | 6.5% | 3.9%(+2.60)#95 | 4.9%(+1.60)#8,682 |
| 96. | Paoli | 6.5% | 3.9%(+2.60)#96 | 4.9%(+1.60)#8,707 |
| 97. | Yuma | 6.3% | 3.9%(+2.40)#97 | 4.9%(+1.40)#8,933 |
| 98. | Cedaredge | 6.3% | 3.9%(+2.40)#98 | 4.9%(+1.40)#8,948 |
| 99. | Limon | 6.3% | 3.9%(+2.40)#99 | 4.9%(+1.40)#8,964 |
| 100. | Gilcrest | 6.3% | 3.9%(+2.40)#100 | 4.9%(+1.40)#8,974 |
Common Questions
What are the Top 10 Cities with the Highest Percentage of Households with Income Below $10,000 in Colorado?
Top 10 Cities with the Highest Percentage of Households with Income Below $10,000 in Colorado are:
#1
100.0%
#2
78.1%
#3
76.4%
#4
75.5%
#5
37.5%
#6
35.8%
#7
33.3%
#8
31.1%
#9
29.8%
#10
27.7%
What city has the Highest Percentage of Households with Income Below $10,000 in Colorado?
Brandon has the Highest Percentage of Households with Income Below $10,000 in Colorado with 100.0%.
What is the Percentage of Households with Income Below $10,000 in the State of Colorado?
Percentage of Households with Income Below $10,000 in Colorado is 3.9%.
What is the Percentage of Households with Income Below $10,000 in the United States?
Percentage of Households with Income Below $10,000 in the United States is 4.9%.