Cities with the Highest Percentage of Households with Income Below $10,000 in New Mexico
RELATED REPORTS & OPTIONS
Household Income | $0-10k
New Mexico
Compare Cities
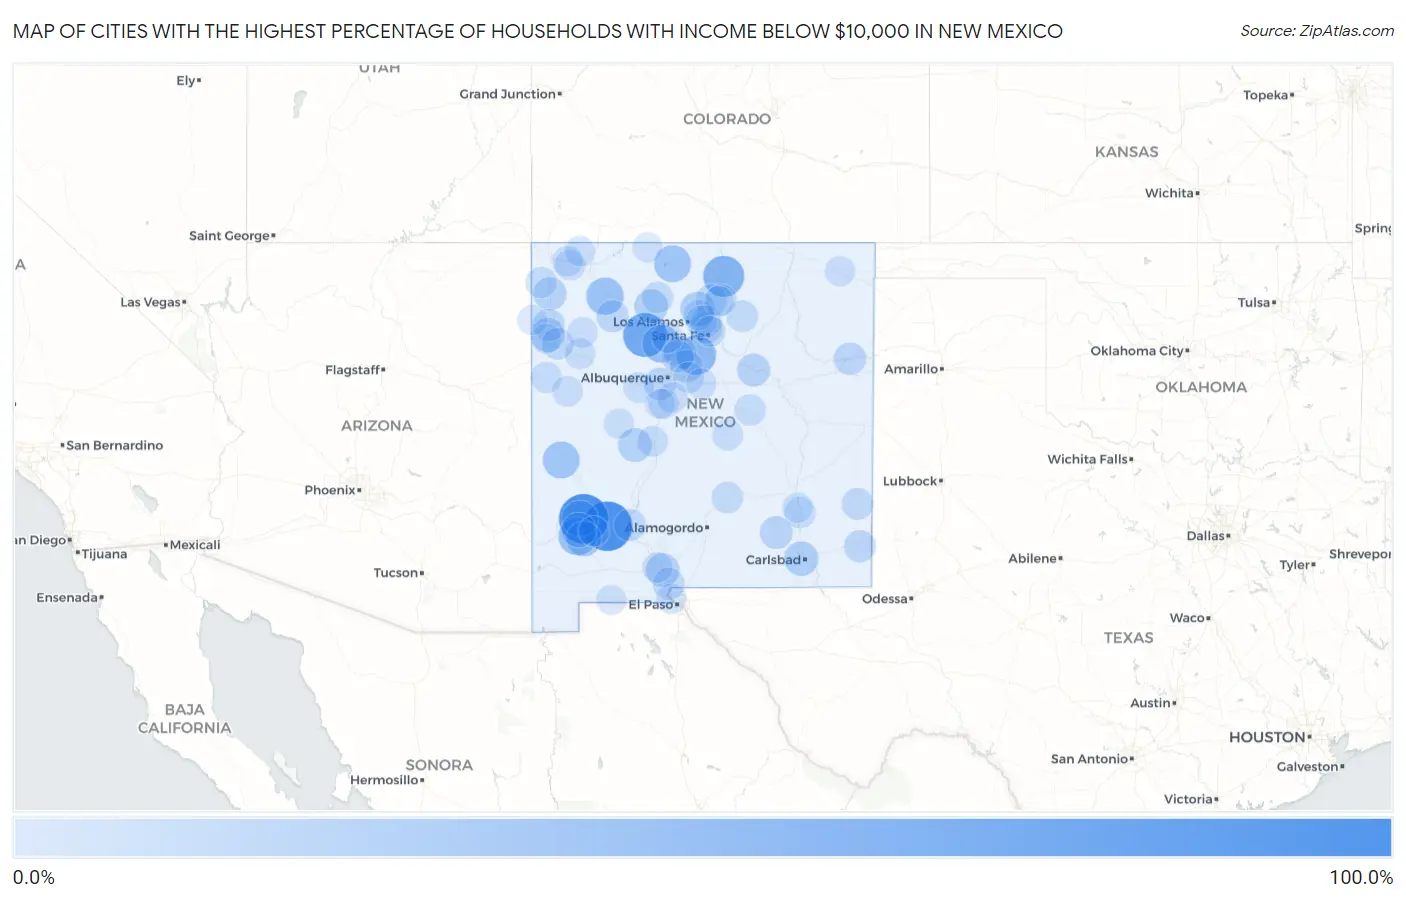
Map of Cities with the Highest Percentage of Households with Income Below $10,000 in New Mexico
0.0%
100.0%
Cities with the Highest Percentage of Households with Income Below $10,000 in New Mexico
| City | Households with Income < $10k | vs State | vs National | |
| 1. | Kingston | 100.0% | 6.8%(+93.2)#1 | 4.9%(+95.1)#7 |
| 2. | Lake Roberts Heights | 100.0% | 6.8%(+93.2)#2 | 4.9%(+95.1)#24 |
| 3. | Homer C Jones | 94.4% | 6.8%(+87.6)#3 | 4.9%(+89.5)#40 |
| 4. | San Luis | 73.3% | 6.8%(+66.5)#4 | 4.9%(+68.4)#62 |
| 5. | Arroyo Hondo | 60.9% | 6.8%(+54.1)#5 | 4.9%(+56.0)#101 |
| 6. | Madrid | 54.0% | 6.8%(+47.2)#6 | 4.9%(+49.1)#138 |
| 7. | Rosedale | 47.4% | 6.8%(+40.6)#7 | 4.9%(+42.5)#194 |
| 8. | Catalpa Canyon | 46.3% | 6.8%(+39.5)#8 | 4.9%(+41.4)#209 |
| 9. | San Ysidro | 46.0% | 6.8%(+39.2)#9 | 4.9%(+41.1)#212 |
| 10. | Nageezi | 44.2% | 6.8%(+37.4)#10 | 4.9%(+39.3)#236 |
| 11. | Borrego Pass | 42.9% | 6.8%(+36.1)#11 | 4.9%(+38.0)#257 |
| 12. | Tierra Amarilla | 41.8% | 6.8%(+35.0)#12 | 4.9%(+36.9)#267 |
| 13. | Aragon | 41.6% | 6.8%(+34.8)#13 | 4.9%(+36.7)#270 |
| 14. | Broadview | 39.8% | 6.8%(+33.0)#14 | 4.9%(+34.9)#305 |
| 15. | Encantado | 39.6% | 6.8%(+32.8)#15 | 4.9%(+34.7)#308 |
| 16. | Trout Valley | 38.9% | 6.8%(+32.1)#16 | 4.9%(+34.0)#320 |
| 17. | Torreon Cdp Sandoval County | 35.3% | 6.8%(+28.5)#17 | 4.9%(+30.4)#392 |
| 18. | North Hurley | 34.2% | 6.8%(+27.4)#18 | 4.9%(+29.3)#421 |
| 19. | Pinos Altos | 32.4% | 6.8%(+25.6)#19 | 4.9%(+27.5)#473 |
| 20. | Pinedale | 30.8% | 6.8%(+24.0)#20 | 4.9%(+25.9)#516 |
| 21. | Happy Valley | 30.3% | 6.8%(+23.5)#21 | 4.9%(+25.4)#536 |
| 22. | El Duende | 30.1% | 6.8%(+23.3)#22 | 4.9%(+25.2)#546 |
| 23. | La Jara | 28.0% | 6.8%(+21.2)#23 | 4.9%(+23.1)#642 |
| 24. | Manuelito | 28.0% | 6.8%(+21.2)#24 | 4.9%(+23.1)#645 |
| 25. | Magdalena | 27.9% | 6.8%(+21.1)#25 | 4.9%(+23.0)#647 |
| 26. | Gamerco | 27.8% | 6.8%(+21.0)#26 | 4.9%(+22.9)#652 |
| 27. | Twin Lakes | 27.6% | 6.8%(+20.8)#27 | 4.9%(+22.7)#661 |
| 28. | University Park | 27.1% | 6.8%(+20.3)#28 | 4.9%(+22.2)#678 |
| 29. | Candy Kitchen | 25.6% | 6.8%(+18.8)#29 | 4.9%(+20.7)#757 |
| 30. | Anton Chico | 25.0% | 6.8%(+18.2)#30 | 4.9%(+20.1)#789 |
| 31. | Haystack | 25.0% | 6.8%(+18.2)#31 | 4.9%(+20.1)#790 |
| 32. | Newcomb | 24.8% | 6.8%(+18.0)#32 | 4.9%(+19.9)#815 |
| 33. | Hope | 24.4% | 6.8%(+17.6)#33 | 4.9%(+19.5)#838 |
| 34. | San Felipe Pueblo | 23.1% | 6.8%(+16.3)#34 | 4.9%(+18.2)#922 |
| 35. | La Madera | 22.6% | 6.8%(+15.8)#35 | 4.9%(+17.7)#965 |
| 36. | Logan | 22.2% | 6.8%(+15.4)#36 | 4.9%(+17.3)#997 |
| 37. | Pajarito Mesa | 21.6% | 6.8%(+14.8)#37 | 4.9%(+16.7)#1,048 |
| 38. | Algodones | 21.5% | 6.8%(+14.7)#38 | 4.9%(+16.6)#1,055 |
| 39. | Middle Mesa | 21.5% | 6.8%(+14.7)#39 | 4.9%(+16.6)#1,061 |
| 40. | Tohatchi | 21.4% | 6.8%(+14.6)#40 | 4.9%(+16.5)#1,070 |
| 41. | Pueblo Pintado | 21.3% | 6.8%(+14.5)#41 | 4.9%(+16.4)#1,084 |
| 42. | Monument | 21.3% | 6.8%(+14.5)#42 | 4.9%(+16.4)#1,086 |
| 43. | Tesuque Pueblo | 21.2% | 6.8%(+14.4)#43 | 4.9%(+16.3)#1,093 |
| 44. | Oasis | 20.2% | 6.8%(+13.4)#44 | 4.9%(+15.3)#1,178 |
| 45. | Berino | 19.7% | 6.8%(+12.9)#45 | 4.9%(+14.8)#1,253 |
| 46. | Church Rock | 19.5% | 6.8%(+12.7)#46 | 4.9%(+14.6)#1,278 |
| 47. | Tatum | 19.4% | 6.8%(+12.6)#47 | 4.9%(+14.5)#1,288 |
| 48. | Cañoncito | 19.1% | 6.8%(+12.3)#48 | 4.9%(+14.2)#1,328 |
| 49. | Mora | 18.6% | 6.8%(+11.8)#49 | 4.9%(+13.7)#1,404 |
| 50. | Ruidoso Downs | 18.3% | 6.8%(+11.5)#50 | 4.9%(+13.4)#1,438 |
| 51. | Dixon | 18.3% | 6.8%(+11.5)#51 | 4.9%(+13.4)#1,441 |
| 52. | Gallina | 18.2% | 6.8%(+11.4)#52 | 4.9%(+13.3)#1,461 |
| 53. | Williams Acres | 18.0% | 6.8%(+11.2)#53 | 4.9%(+13.1)#1,487 |
| 54. | Nambe | 17.8% | 6.8%(+11.0)#54 | 4.9%(+12.9)#1,519 |
| 55. | Picuris Pueblo | 17.4% | 6.8%(+10.6)#55 | 4.9%(+12.5)#1,582 |
| 56. | Hagerman | 17.3% | 6.8%(+10.5)#56 | 4.9%(+12.4)#1,592 |
| 57. | Prewitt | 17.3% | 6.8%(+10.5)#57 | 4.9%(+12.4)#1,593 |
| 58. | Vaughn | 17.3% | 6.8%(+10.5)#58 | 4.9%(+12.4)#1,598 |
| 59. | Jaconita | 17.3% | 6.8%(+10.5)#59 | 4.9%(+12.4)#1,600 |
| 60. | Iyanbito | 17.0% | 6.8%(+10.2)#60 | 4.9%(+12.1)#1,641 |
| 61. | Sanostee | 16.9% | 6.8%(+10.1)#61 | 4.9%(+12.0)#1,676 |
| 62. | Totah Vista | 16.8% | 6.8%(+10.00)#62 | 4.9%(+11.9)#1,700 |
| 63. | Black Rock | 16.6% | 6.8%(+9.80)#63 | 4.9%(+11.7)#1,755 |
| 64. | San Antonito Cdp Bernalillo County | 15.9% | 6.8%(+9.10)#64 | 4.9%(+11.0)#1,887 |
| 65. | Corona | 15.9% | 6.8%(+9.10)#65 | 4.9%(+11.0)#1,893 |
| 66. | Highland Meadows | 15.7% | 6.8%(+8.90)#66 | 4.9%(+10.8)#1,939 |
| 67. | Placitas Cdp Dona Ana County | 15.6% | 6.8%(+8.80)#67 | 4.9%(+10.7)#1,951 |
| 68. | Santa Clara Pueblo | 15.4% | 6.8%(+8.60)#68 | 4.9%(+10.5)#2,000 |
| 69. | Ponderosa | 15.4% | 6.8%(+8.60)#69 | 4.9%(+10.5)#2,011 |
| 70. | Lemitar | 15.3% | 6.8%(+8.50)#70 | 4.9%(+10.4)#2,031 |
| 71. | Thoreau | 15.1% | 6.8%(+8.30)#71 | 4.9%(+10.2)#2,065 |
| 72. | Tesuque | 15.1% | 6.8%(+8.30)#72 | 4.9%(+10.2)#2,068 |
| 73. | Ojo Amarillo | 14.9% | 6.8%(+8.10)#73 | 4.9%(+10.00)#2,127 |
| 74. | Sedillo | 14.8% | 6.8%(+8.00)#74 | 4.9%(+9.90)#2,158 |
| 75. | Meadow Lake | 14.7% | 6.8%(+7.90)#75 | 4.9%(+9.80)#2,172 |
| 76. | Angustura | 14.5% | 6.8%(+7.70)#76 | 4.9%(+9.60)#2,231 |
| 77. | Crownpoint | 14.4% | 6.8%(+7.60)#77 | 4.9%(+9.50)#2,248 |
| 78. | Adelino | 14.3% | 6.8%(+7.50)#78 | 4.9%(+9.40)#2,271 |
| 79. | La Bajada | 14.3% | 6.8%(+7.50)#79 | 4.9%(+9.40)#2,301 |
| 80. | Pinehill | 14.2% | 6.8%(+7.40)#80 | 4.9%(+9.30)#2,316 |
| 81. | Nenahnezad | 14.1% | 6.8%(+7.30)#81 | 4.9%(+9.20)#2,340 |
| 82. | Moriarty | 14.0% | 6.8%(+7.20)#82 | 4.9%(+9.10)#2,357 |
| 83. | Canada De Los Alamos | 13.9% | 6.8%(+7.10)#83 | 4.9%(+9.00)#2,396 |
| 84. | La Plata | 13.7% | 6.8%(+6.90)#84 | 4.9%(+8.80)#2,453 |
| 85. | Fairacres | 13.6% | 6.8%(+6.80)#85 | 4.9%(+8.70)#2,485 |
| 86. | Mimbres | 13.5% | 6.8%(+6.70)#86 | 4.9%(+8.60)#2,525 |
| 87. | Sunland Park | 13.3% | 6.8%(+6.50)#87 | 4.9%(+8.40)#2,565 |
| 88. | Grenville | 13.3% | 6.8%(+6.50)#88 | 4.9%(+8.40)#2,617 |
| 89. | Alamo | 13.1% | 6.8%(+6.30)#89 | 4.9%(+8.20)#2,674 |
| 90. | Dulce | 12.9% | 6.8%(+6.10)#90 | 4.9%(+8.00)#2,748 |
| 91. | Conejo | 12.9% | 6.8%(+6.10)#91 | 4.9%(+8.00)#2,765 |
| 92. | Yah Ta Hey | 12.8% | 6.8%(+6.00)#92 | 4.9%(+7.90)#2,795 |
| 93. | Chamisal | 12.8% | 6.8%(+6.00)#93 | 4.9%(+7.90)#2,802 |
| 94. | Dexter | 12.7% | 6.8%(+5.90)#94 | 4.9%(+7.80)#2,828 |
| 95. | Belen | 12.5% | 6.8%(+5.70)#95 | 4.9%(+7.60)#2,893 |
| 96. | Navajo | 12.5% | 6.8%(+5.70)#96 | 4.9%(+7.60)#2,904 |
| 97. | Isleta | 12.5% | 6.8%(+5.70)#97 | 4.9%(+7.60)#2,918 |
| 98. | Sundance | 12.5% | 6.8%(+5.70)#98 | 4.9%(+7.60)#2,921 |
| 99. | Columbus | 12.4% | 6.8%(+5.60)#99 | 4.9%(+7.50)#2,976 |
| 100. | San Jose Cdp Rio Arriba County | 12.3% | 6.8%(+5.50)#100 | 4.9%(+7.40)#3,027 |
Common Questions
What are the Top 10 Cities with the Highest Percentage of Households with Income Below $10,000 in New Mexico?
Top 10 Cities with the Highest Percentage of Households with Income Below $10,000 in New Mexico are:
#1
100.0%
#2
100.0%
#3
73.3%
#4
60.9%
#5
54.0%
#6
47.4%
#7
46.0%
#8
44.2%
#9
41.8%
#10
41.6%
What city has the Highest Percentage of Households with Income Below $10,000 in New Mexico?
Kingston has the Highest Percentage of Households with Income Below $10,000 in New Mexico with 100.0%.
What is the Percentage of Households with Income Below $10,000 in the State of New Mexico?
Percentage of Households with Income Below $10,000 in New Mexico is 6.8%.
What is the Percentage of Households with Income Below $10,000 in the United States?
Percentage of Households with Income Below $10,000 in the United States is 4.9%.