Cities with the Highest Percentage of Households with Income Below $10,000 in Oregon
RELATED REPORTS & OPTIONS
Household Income | $0-10k
Oregon
Compare Cities
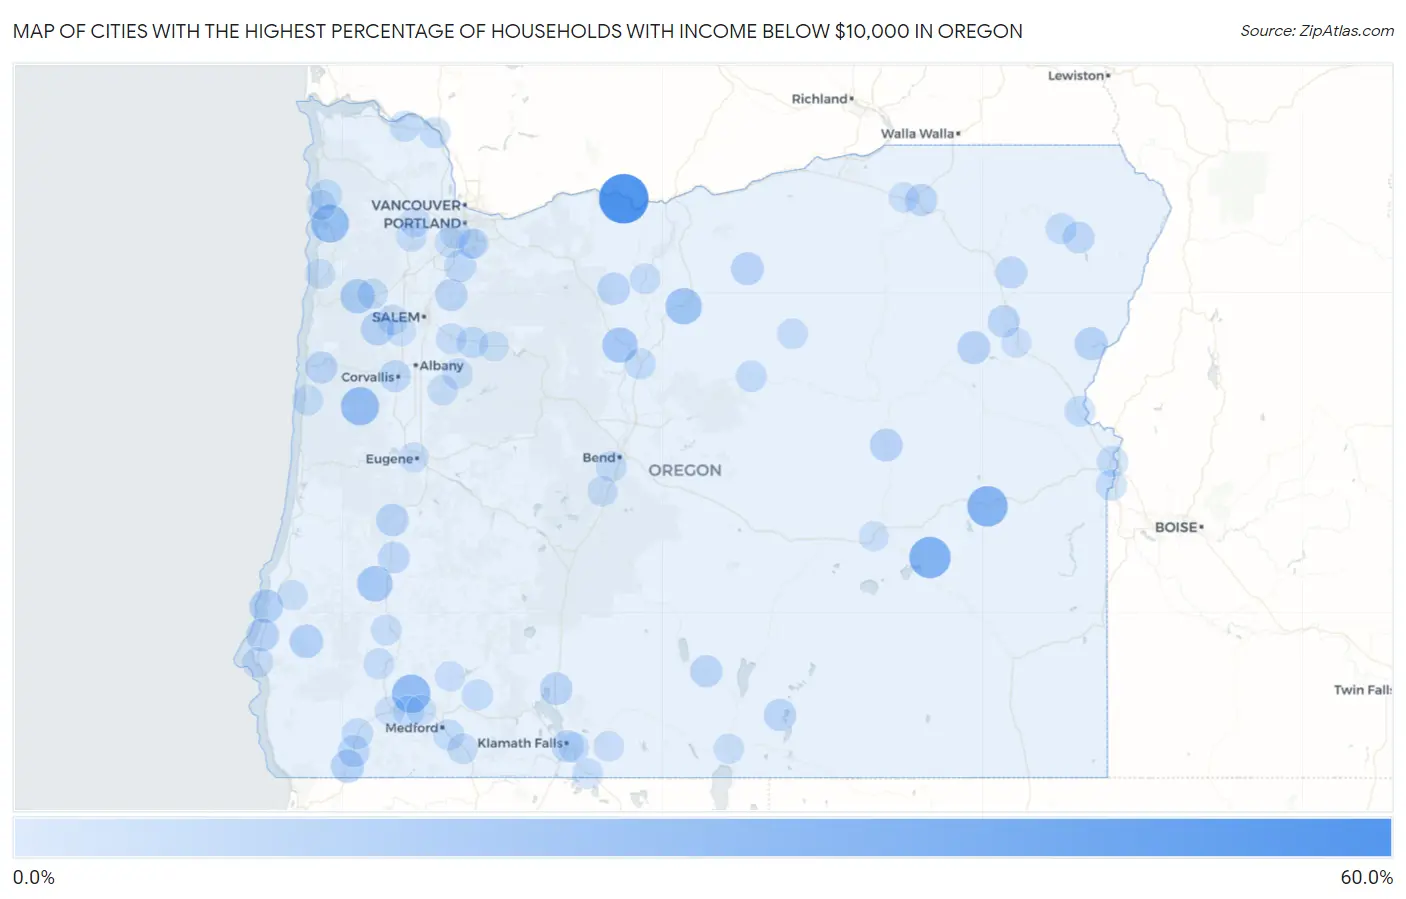
Map of Cities with the Highest Percentage of Households with Income Below $10,000 in Oregon
0.0%
60.0%
Cities with the Highest Percentage of Households with Income Below $10,000 in Oregon
| City | Households with Income < $10k | vs State | vs National | |
| 1. | Rowena | 57.9% | 4.4%(+53.5)#1 | 4.9%(+53.0)#113 |
| 2. | Trent | 46.6% | 4.4%(+42.2)#2 | 4.9%(+41.7)#206 |
| 3. | Crane | 35.3% | 4.4%(+30.9)#3 | 4.9%(+30.4)#393 |
| 4. | Juntura | 33.3% | 4.4%(+28.9)#4 | 4.9%(+28.4)#458 |
| 5. | Wimer | 27.7% | 4.4%(+23.3)#5 | 4.9%(+22.8)#658 |
| 6. | Alsea | 26.9% | 4.4%(+22.5)#6 | 4.9%(+22.0)#694 |
| 7. | Fort Klamath | 26.5% | 4.4%(+22.1)#7 | 4.9%(+21.6)#711 |
| 8. | Idaville | 26.1% | 4.4%(+21.7)#8 | 4.9%(+21.2)#732 |
| 9. | Shaniko | 22.2% | 4.4%(+17.8)#9 | 4.9%(+17.3)#1,006 |
| 10. | Beaver Marsh | 20.9% | 4.4%(+16.5)#10 | 4.9%(+16.0)#1,118 |
| 11. | Rocky Point | 20.4% | 4.4%(+16.0)#11 | 4.9%(+15.5)#1,157 |
| 12. | Melrose | 20.0% | 4.4%(+15.6)#12 | 4.9%(+15.1)#1,193 |
| 13. | Warm Springs | 19.5% | 4.4%(+15.1)#13 | 4.9%(+14.6)#1,276 |
| 14. | Crescent | 19.2% | 4.4%(+14.8)#14 | 4.9%(+14.3)#1,317 |
| 15. | Gilchrist | 19.0% | 4.4%(+14.6)#15 | 4.9%(+14.1)#1,341 |
| 16. | Grand Ronde | 17.0% | 4.4%(+12.6)#16 | 4.9%(+12.1)#1,640 |
| 17. | Bandon | 14.7% | 4.4%(+10.3)#17 | 4.9%(+9.80)#2,173 |
| 18. | Powers | 14.7% | 4.4%(+10.3)#18 | 4.9%(+9.80)#2,185 |
| 19. | River Point | 14.5% | 4.4%(+10.1)#19 | 4.9%(+9.60)#2,239 |
| 20. | Saunders Lake | 14.2% | 4.4%(+9.80)#20 | 4.9%(+9.30)#2,308 |
| 21. | Falls City | 14.0% | 4.4%(+9.60)#21 | 4.9%(+9.10)#2,361 |
| 22. | Richland | 13.9% | 4.4%(+9.50)#22 | 4.9%(+9.00)#2,406 |
| 23. | O Brien | 13.8% | 4.4%(+9.40)#23 | 4.9%(+8.90)#2,434 |
| 24. | Sumpter | 13.4% | 4.4%(+9.00)#24 | 4.9%(+8.50)#2,562 |
| 25. | Langlois | 13.3% | 4.4%(+8.90)#25 | 4.9%(+8.40)#2,602 |
| 26. | Seneca | 12.8% | 4.4%(+8.40)#26 | 4.9%(+7.90)#2,806 |
| 27. | Condon | 12.7% | 4.4%(+8.30)#27 | 4.9%(+7.80)#2,831 |
| 28. | Chiloquin | 12.4% | 4.4%(+8.00)#28 | 4.9%(+7.50)#2,985 |
| 29. | Drain | 12.3% | 4.4%(+7.90)#29 | 4.9%(+7.40)#3,022 |
| 30. | Plush | 11.9% | 4.4%(+7.50)#30 | 4.9%(+7.00)#3,259 |
| 31. | Mount Angel | 11.7% | 4.4%(+7.30)#31 | 4.9%(+6.80)#3,324 |
| 32. | Pine Grove | 11.7% | 4.4%(+7.30)#32 | 4.9%(+6.80)#3,362 |
| 33. | Mission | 11.5% | 4.4%(+7.10)#33 | 4.9%(+6.60)#3,445 |
| 34. | Paisley | 11.3% | 4.4%(+6.90)#34 | 4.9%(+6.40)#3,595 |
| 35. | Haines | 11.3% | 4.4%(+6.90)#35 | 4.9%(+6.40)#3,599 |
| 36. | Toledo | 11.0% | 4.4%(+6.60)#36 | 4.9%(+6.10)#3,717 |
| 37. | Klamath Falls | 10.8% | 4.4%(+6.40)#37 | 4.9%(+5.90)#3,835 |
| 38. | Cave Junction | 10.7% | 4.4%(+6.30)#38 | 4.9%(+5.80)#3,926 |
| 39. | Barlow | 10.7% | 4.4%(+6.30)#39 | 4.9%(+5.80)#3,960 |
| 40. | Corvallis | 10.6% | 4.4%(+6.20)#40 | 4.9%(+5.70)#3,968 |
| 41. | Union | 10.5% | 4.4%(+6.10)#41 | 4.9%(+5.60)#4,044 |
| 42. | Cherry Grove | 10.5% | 4.4%(+6.10)#42 | 4.9%(+5.60)#4,070 |
| 43. | Enterprise | 10.2% | 4.4%(+5.80)#43 | 4.9%(+5.30)#4,262 |
| 44. | Oakland | 10.1% | 4.4%(+5.70)#44 | 4.9%(+5.20)#4,334 |
| 45. | Wheeler | 9.6% | 4.4%(+5.20)#45 | 4.9%(+4.70)#4,726 |
| 46. | Jasper | 9.5% | 4.4%(+5.10)#46 | 4.9%(+4.60)#4,793 |
| 47. | Lyons | 9.4% | 4.4%(+5.00)#47 | 4.9%(+4.50)#4,868 |
| 48. | Madras | 9.1% | 4.4%(+4.70)#48 | 4.9%(+4.20)#5,112 |
| 49. | Lostine | 9.1% | 4.4%(+4.70)#49 | 4.9%(+4.20)#5,163 |
| 50. | Ontario | 9.0% | 4.4%(+4.60)#50 | 4.9%(+4.10)#5,214 |
| 51. | Dexter | 9.0% | 4.4%(+4.60)#51 | 4.9%(+4.10)#5,272 |
| 52. | Svensen | 9.0% | 4.4%(+4.60)#52 | 4.9%(+4.10)#5,279 |
| 53. | Butte Falls | 9.0% | 4.4%(+4.60)#53 | 4.9%(+4.10)#5,295 |
| 54. | Rainier | 8.8% | 4.4%(+4.40)#54 | 4.9%(+3.90)#5,457 |
| 55. | Selma | 8.8% | 4.4%(+4.40)#55 | 4.9%(+3.90)#5,482 |
| 56. | Nyssa | 8.7% | 4.4%(+4.30)#56 | 4.9%(+3.80)#5,571 |
| 57. | Clatskanie | 8.7% | 4.4%(+4.30)#57 | 4.9%(+3.80)#5,583 |
| 58. | Mitchell | 8.6% | 4.4%(+4.20)#58 | 4.9%(+3.70)#5,736 |
| 59. | Huntington | 8.5% | 4.4%(+4.10)#59 | 4.9%(+3.60)#5,829 |
| 60. | San Marine | 8.5% | 4.4%(+4.10)#60 | 4.9%(+3.60)#5,838 |
| 61. | Rogue River | 8.4% | 4.4%(+4.00)#61 | 4.9%(+3.50)#5,915 |
| 62. | Phoenix | 8.3% | 4.4%(+3.90)#62 | 4.9%(+3.40)#6,006 |
| 63. | Stayton | 8.2% | 4.4%(+3.80)#63 | 4.9%(+3.30)#6,122 |
| 64. | Port Orford | 8.2% | 4.4%(+3.80)#64 | 4.9%(+3.30)#6,161 |
| 65. | Glendale | 8.2% | 4.4%(+3.80)#65 | 4.9%(+3.30)#6,165 |
| 66. | Waldport | 8.0% | 4.4%(+3.60)#66 | 4.9%(+3.10)#6,361 |
| 67. | Riddle | 8.0% | 4.4%(+3.60)#67 | 4.9%(+3.10)#6,372 |
| 68. | Maupin | 8.0% | 4.4%(+3.60)#68 | 4.9%(+3.10)#6,412 |
| 69. | Seventh Mountain | 7.8% | 4.4%(+3.40)#69 | 4.9%(+2.90)#6,670 |
| 70. | Willamina | 7.7% | 4.4%(+3.30)#70 | 4.9%(+2.80)#6,744 |
| 71. | Bayshore | 7.7% | 4.4%(+3.30)#71 | 4.9%(+2.80)#6,776 |
| 72. | Gaston | 7.7% | 4.4%(+3.30)#72 | 4.9%(+2.80)#6,784 |
| 73. | Lacomb | 7.6% | 4.4%(+3.20)#73 | 4.9%(+2.70)#6,951 |
| 74. | Ashland | 7.5% | 4.4%(+3.10)#74 | 4.9%(+2.60)#7,005 |
| 75. | Merrill | 7.5% | 4.4%(+3.10)#75 | 4.9%(+2.60)#7,090 |
| 76. | Dallas | 7.4% | 4.4%(+3.00)#76 | 4.9%(+2.50)#7,168 |
| 77. | Spray | 7.4% | 4.4%(+3.00)#77 | 4.9%(+2.50)#7,275 |
| 78. | Coquille | 7.3% | 4.4%(+2.90)#78 | 4.9%(+2.40)#7,333 |
| 79. | Sodaville | 7.2% | 4.4%(+2.80)#79 | 4.9%(+2.30)#7,575 |
| 80. | Bly | 7.2% | 4.4%(+2.80)#80 | 4.9%(+2.30)#7,587 |
| 81. | Altamont | 7.1% | 4.4%(+2.70)#81 | 4.9%(+2.20)#7,602 |
| 82. | Three Rivers | 6.9% | 4.4%(+2.50)#82 | 4.9%(+2.00)#7,936 |
| 83. | Trail | 6.9% | 4.4%(+2.50)#83 | 4.9%(+2.00)#7,998 |
| 84. | Bonanza | 6.9% | 4.4%(+2.50)#84 | 4.9%(+2.00)#8,006 |
| 85. | King City | 6.8% | 4.4%(+2.40)#85 | 4.9%(+1.90)#8,096 |
| 86. | Forest Grove | 6.7% | 4.4%(+2.30)#86 | 4.9%(+1.80)#8,240 |
| 87. | Lakeview | 6.7% | 4.4%(+2.30)#87 | 4.9%(+1.80)#8,287 |
| 88. | Eugene | 6.6% | 4.4%(+2.20)#88 | 4.9%(+1.70)#8,384 |
| 89. | Gold Hill | 6.5% | 4.4%(+2.10)#89 | 4.9%(+1.60)#8,626 |
| 90. | Jennings Lodge | 6.4% | 4.4%(+2.00)#90 | 4.9%(+1.50)#8,745 |
| 91. | Metzger | 6.4% | 4.4%(+2.00)#91 | 4.9%(+1.50)#8,766 |
| 92. | Grants Pass | 6.3% | 4.4%(+1.90)#92 | 4.9%(+1.40)#8,873 |
| 93. | Gladstone | 6.3% | 4.4%(+1.90)#93 | 4.9%(+1.40)#8,899 |
| 94. | Gates | 6.3% | 4.4%(+1.90)#94 | 4.9%(+1.40)#9,018 |
| 95. | Monmouth | 6.2% | 4.4%(+1.80)#95 | 4.9%(+1.30)#9,100 |
| 96. | Pacific City | 6.2% | 4.4%(+1.80)#96 | 4.9%(+1.30)#9,160 |
| 97. | Hines | 6.2% | 4.4%(+1.80)#97 | 4.9%(+1.30)#9,163 |
| 98. | Pendleton | 6.1% | 4.4%(+1.70)#98 | 4.9%(+1.20)#9,250 |
| 99. | Baker City | 6.1% | 4.4%(+1.70)#99 | 4.9%(+1.20)#9,266 |
| 100. | Rockaway Beach | 6.1% | 4.4%(+1.70)#100 | 4.9%(+1.20)#9,356 |
Common Questions
What are the Top 10 Cities with the Highest Percentage of Households with Income Below $10,000 in Oregon?
Top 10 Cities with the Highest Percentage of Households with Income Below $10,000 in Oregon are:
#1
57.9%
#2
35.3%
#3
33.3%
#4
27.7%
#5
26.9%
#6
26.1%
#7
22.2%
#8
20.0%
#9
19.5%
#10
17.0%
What city has the Highest Percentage of Households with Income Below $10,000 in Oregon?
Rowena has the Highest Percentage of Households with Income Below $10,000 in Oregon with 57.9%.
What is the Percentage of Households with Income Below $10,000 in the State of Oregon?
Percentage of Households with Income Below $10,000 in Oregon is 4.4%.
What is the Percentage of Households with Income Below $10,000 in the United States?
Percentage of Households with Income Below $10,000 in the United States is 4.9%.