Cities with the Highest Percentage of Households with Income Below $10,000 in Michigan
RELATED REPORTS & OPTIONS
Household Income | $0-10k
Michigan
Compare Cities
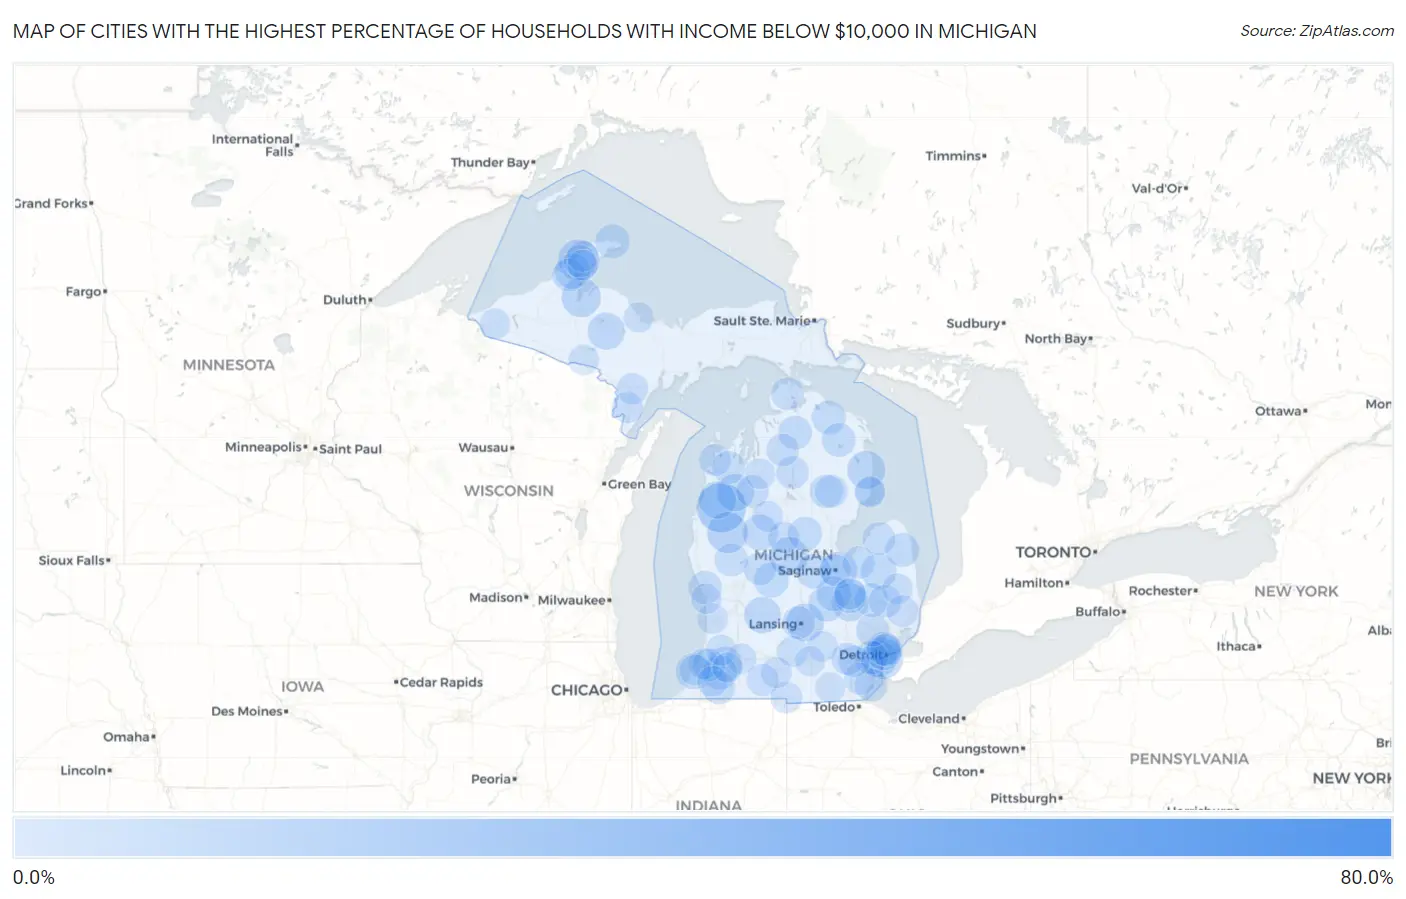
Map of Cities with the Highest Percentage of Households with Income Below $10,000 in Michigan
0.0%
80.0%
Cities with the Highest Percentage of Households with Income Below $10,000 in Michigan
| City | Households with Income < $10k | vs State | vs National | |
| 1. | Pelkie | 76.0% | 5.0%(+71.0)#1 | 4.9%(+71.1)#56 |
| 2. | Wellston | 24.8% | 5.0%(+19.8)#2 | 4.9%(+19.9)#817 |
| 3. | Calumet | 18.1% | 5.0%(+13.1)#3 | 4.9%(+13.2)#1,476 |
| 4. | River Rouge | 17.5% | 5.0%(+12.5)#4 | 4.9%(+12.6)#1,558 |
| 5. | Baldwin | 17.5% | 5.0%(+12.5)#5 | 4.9%(+12.6)#1,562 |
| 6. | Kincheloe | 16.4% | 5.0%(+11.4)#6 | 4.9%(+11.5)#1,785 |
| 7. | Falmouth | 16.4% | 5.0%(+11.4)#7 | 4.9%(+11.5)#1,794 |
| 8. | Zeba | 16.2% | 5.0%(+11.2)#8 | 4.9%(+11.3)#1,826 |
| 9. | Cambria | 16.0% | 5.0%(+11.0)#9 | 4.9%(+11.1)#1,868 |
| 10. | Mount Pleasant | 15.4% | 5.0%(+10.4)#10 | 4.9%(+10.5)#1,988 |
| 11. | Lincoln | 15.2% | 5.0%(+10.2)#11 | 4.9%(+10.3)#2,056 |
| 12. | East Lansing | 14.9% | 5.0%(+9.90)#12 | 4.9%(+10.00)#2,108 |
| 13. | Millburg | 14.9% | 5.0%(+9.90)#13 | 4.9%(+10.00)#2,126 |
| 14. | Flint | 14.8% | 5.0%(+9.80)#14 | 4.9%(+9.90)#2,140 |
| 15. | Mesick | 14.7% | 5.0%(+9.70)#15 | 4.9%(+9.80)#2,188 |
| 16. | Brethren | 14.6% | 5.0%(+9.60)#16 | 4.9%(+9.70)#2,214 |
| 17. | Republic | 14.5% | 5.0%(+9.50)#17 | 4.9%(+9.60)#2,237 |
| 18. | Ewen | 14.3% | 5.0%(+9.30)#18 | 4.9%(+9.40)#2,277 |
| 19. | Clarksville | 14.0% | 5.0%(+9.00)#19 | 4.9%(+9.10)#2,372 |
| 20. | Melvindale | 13.8% | 5.0%(+8.80)#20 | 4.9%(+8.90)#2,413 |
| 21. | Buena Vista | 13.8% | 5.0%(+8.80)#21 | 4.9%(+8.90)#2,416 |
| 22. | Mohawk | 13.8% | 5.0%(+8.80)#22 | 4.9%(+8.90)#2,440 |
| 23. | Benton Harbor | 13.6% | 5.0%(+8.60)#23 | 4.9%(+8.70)#2,473 |
| 24. | Evart | 13.4% | 5.0%(+8.40)#24 | 4.9%(+8.50)#2,542 |
| 25. | Corunna | 13.3% | 5.0%(+8.30)#25 | 4.9%(+8.40)#2,570 |
| 26. | Kingston | 13.1% | 5.0%(+8.10)#26 | 4.9%(+8.20)#2,682 |
| 27. | Detroit | 13.0% | 5.0%(+8.00)#27 | 4.9%(+8.10)#2,690 |
| 28. | Houghton | 13.0% | 5.0%(+8.00)#28 | 4.9%(+8.10)#2,692 |
| 29. | Stanton | 12.7% | 5.0%(+7.70)#29 | 4.9%(+7.80)#2,826 |
| 30. | New Lothrop | 12.6% | 5.0%(+7.60)#30 | 4.9%(+7.70)#2,862 |
| 31. | Paw Paw | 12.4% | 5.0%(+7.40)#31 | 4.9%(+7.50)#2,965 |
| 32. | Merrill | 12.4% | 5.0%(+7.40)#32 | 4.9%(+7.50)#2,982 |
| 33. | Chassell | 12.2% | 5.0%(+7.20)#33 | 4.9%(+7.30)#3,071 |
| 34. | Copper Harbor | 12.2% | 5.0%(+7.20)#34 | 4.9%(+7.30)#3,090 |
| 35. | Decatur | 12.0% | 5.0%(+7.00)#35 | 4.9%(+7.10)#3,158 |
| 36. | Beaverton | 11.8% | 5.0%(+6.80)#36 | 4.9%(+6.90)#3,286 |
| 37. | Minden City | 11.8% | 5.0%(+6.80)#37 | 4.9%(+6.90)#3,305 |
| 38. | Millersburg | 11.8% | 5.0%(+6.80)#38 | 4.9%(+6.90)#3,306 |
| 39. | Lapeer | 11.6% | 5.0%(+6.60)#39 | 4.9%(+6.70)#3,368 |
| 40. | Hillman | 11.6% | 5.0%(+6.60)#40 | 4.9%(+6.70)#3,397 |
| 41. | Vanderbilt | 11.6% | 5.0%(+6.60)#41 | 4.9%(+6.70)#3,406 |
| 42. | Muskegon Heights | 11.5% | 5.0%(+6.50)#42 | 4.9%(+6.60)#3,427 |
| 43. | Beecher | 11.5% | 5.0%(+6.50)#43 | 4.9%(+6.60)#3,429 |
| 44. | Highland Park | 11.5% | 5.0%(+6.50)#44 | 4.9%(+6.60)#3,430 |
| 45. | Inkster | 11.4% | 5.0%(+6.40)#45 | 4.9%(+6.50)#3,470 |
| 46. | Cassopolis | 11.3% | 5.0%(+6.30)#46 | 4.9%(+6.40)#3,562 |
| 47. | Rose City | 11.3% | 5.0%(+6.30)#47 | 4.9%(+6.40)#3,584 |
| 48. | White Cloud | 11.0% | 5.0%(+6.00)#48 | 4.9%(+6.10)#3,728 |
| 49. | Elkton | 11.0% | 5.0%(+6.00)#49 | 4.9%(+6.10)#3,740 |
| 50. | Pontiac | 10.9% | 5.0%(+5.90)#50 | 4.9%(+6.00)#3,758 |
| 51. | Woodland Beach | 10.9% | 5.0%(+5.90)#51 | 4.9%(+6.00)#3,775 |
| 52. | Edgemont Park | 10.9% | 5.0%(+5.90)#52 | 4.9%(+6.00)#3,776 |
| 53. | Grayling | 10.9% | 5.0%(+5.90)#53 | 4.9%(+6.00)#3,785 |
| 54. | Lakeview | 10.9% | 5.0%(+5.90)#54 | 4.9%(+6.00)#3,795 |
| 55. | Hardwood Acres | 10.9% | 5.0%(+5.90)#55 | 4.9%(+6.00)#3,809 |
| 56. | Lupton | 10.8% | 5.0%(+5.80)#56 | 4.9%(+5.90)#3,894 |
| 57. | Levering | 10.8% | 5.0%(+5.80)#57 | 4.9%(+5.90)#3,903 |
| 58. | Hamtramck | 10.7% | 5.0%(+5.70)#58 | 4.9%(+5.80)#3,907 |
| 59. | Imlay City | 10.7% | 5.0%(+5.70)#59 | 4.9%(+5.80)#3,918 |
| 60. | Hartford | 10.7% | 5.0%(+5.70)#60 | 4.9%(+5.80)#3,921 |
| 61. | Lakes Of The North | 10.7% | 5.0%(+5.70)#61 | 4.9%(+5.80)#3,933 |
| 62. | South Range | 10.7% | 5.0%(+5.70)#62 | 4.9%(+5.80)#3,945 |
| 63. | Fairgrove | 10.7% | 5.0%(+5.70)#63 | 4.9%(+5.80)#3,946 |
| 64. | Manton | 10.6% | 5.0%(+5.60)#64 | 4.9%(+5.70)#3,998 |
| 65. | Ann Arbor | 10.5% | 5.0%(+5.50)#65 | 4.9%(+5.60)#4,028 |
| 66. | Laurium | 10.5% | 5.0%(+5.50)#66 | 4.9%(+5.60)#4,046 |
| 67. | Saginaw | 10.2% | 5.0%(+5.20)#67 | 4.9%(+5.30)#4,236 |
| 68. | Maybee | 10.2% | 5.0%(+5.20)#68 | 4.9%(+5.30)#4,281 |
| 69. | Empire | 10.2% | 5.0%(+5.20)#69 | 4.9%(+5.30)#4,284 |
| 70. | Sherwood | 10.1% | 5.0%(+5.10)#70 | 4.9%(+5.20)#4,353 |
| 71. | Ypsilanti | 9.9% | 5.0%(+4.90)#71 | 4.9%(+5.00)#4,437 |
| 72. | Memphis | 9.9% | 5.0%(+4.90)#72 | 4.9%(+5.00)#4,469 |
| 73. | Farwell | 9.9% | 5.0%(+4.90)#73 | 4.9%(+5.00)#4,471 |
| 74. | Montgomery | 9.9% | 5.0%(+4.90)#74 | 4.9%(+5.00)#4,494 |
| 75. | Mount Morris | 9.6% | 5.0%(+4.60)#75 | 4.9%(+4.70)#4,685 |
| 76. | Powers | 9.6% | 5.0%(+4.60)#76 | 4.9%(+4.70)#4,730 |
| 77. | Daggett | 9.6% | 5.0%(+4.60)#77 | 4.9%(+4.70)#4,740 |
| 78. | Tekonsha | 9.4% | 5.0%(+4.40)#78 | 4.9%(+4.50)#4,884 |
| 79. | Marion | 9.4% | 5.0%(+4.40)#79 | 4.9%(+4.50)#4,885 |
| 80. | Ahmeek | 9.3% | 5.0%(+4.30)#80 | 4.9%(+4.40)#5,002 |
| 81. | Paw Paw Lake | 9.2% | 5.0%(+4.20)#81 | 4.9%(+4.30)#5,029 |
| 82. | Springport | 9.2% | 5.0%(+4.20)#82 | 4.9%(+4.30)#5,062 |
| 83. | Benton Heights | 9.1% | 5.0%(+4.10)#83 | 4.9%(+4.20)#5,121 |
| 84. | Beechwood | 9.1% | 5.0%(+4.10)#84 | 4.9%(+4.20)#5,126 |
| 85. | Stockbridge | 9.1% | 5.0%(+4.10)#85 | 4.9%(+4.20)#5,142 |
| 86. | Bloomingdale | 9.1% | 5.0%(+4.10)#86 | 4.9%(+4.20)#5,160 |
| 87. | Melvin | 9.1% | 5.0%(+4.10)#87 | 4.9%(+4.20)#5,181 |
| 88. | Wakefield | 9.0% | 5.0%(+4.00)#88 | 4.9%(+4.10)#5,257 |
| 89. | Lake Linden | 9.0% | 5.0%(+4.00)#89 | 4.9%(+4.10)#5,269 |
| 90. | South Boardman | 9.0% | 5.0%(+4.00)#90 | 4.9%(+4.10)#5,285 |
| 91. | Alpha | 9.0% | 5.0%(+4.00)#91 | 4.9%(+4.10)#5,305 |
| 92. | Kalamazoo | 8.9% | 5.0%(+3.90)#92 | 4.9%(+4.00)#5,310 |
| 93. | Dowagiac | 8.9% | 5.0%(+3.90)#93 | 4.9%(+4.00)#5,328 |
| 94. | Au Sable | 8.8% | 5.0%(+3.80)#94 | 4.9%(+3.90)#5,464 |
| 95. | Jackson | 8.7% | 5.0%(+3.70)#95 | 4.9%(+3.80)#5,532 |
| 96. | Marquette | 8.7% | 5.0%(+3.70)#96 | 4.9%(+3.80)#5,537 |
| 97. | Adrian | 8.7% | 5.0%(+3.70)#97 | 4.9%(+3.80)#5,538 |
| 98. | Grand Haven | 8.7% | 5.0%(+3.70)#98 | 4.9%(+3.80)#5,546 |
| 99. | Lawton | 8.7% | 5.0%(+3.70)#99 | 4.9%(+3.80)#5,586 |
| 100. | Oscoda | 8.7% | 5.0%(+3.70)#100 | 4.9%(+3.80)#5,599 |
Common Questions
What are the Top 10 Cities with the Highest Percentage of Households with Income Below $10,000 in Michigan?
Top 10 Cities with the Highest Percentage of Households with Income Below $10,000 in Michigan are:
#1
24.8%
#2
18.1%
#3
17.5%
#4
17.5%
#5
16.2%
#6
15.4%
#7
15.2%
#8
14.9%
#9
14.8%
#10
14.7%
What city has the Highest Percentage of Households with Income Below $10,000 in Michigan?
Wellston has the Highest Percentage of Households with Income Below $10,000 in Michigan with 24.8%.
What is the Percentage of Households with Income Below $10,000 in the State of Michigan?
Percentage of Households with Income Below $10,000 in Michigan is 5.0%.
What is the Percentage of Households with Income Below $10,000 in the United States?
Percentage of Households with Income Below $10,000 in the United States is 4.9%.