Cities with the Highest Percentage of Households with Income Below $10,000 in Idaho
RELATED REPORTS & OPTIONS
Household Income | $0-10k
Idaho
Compare Cities
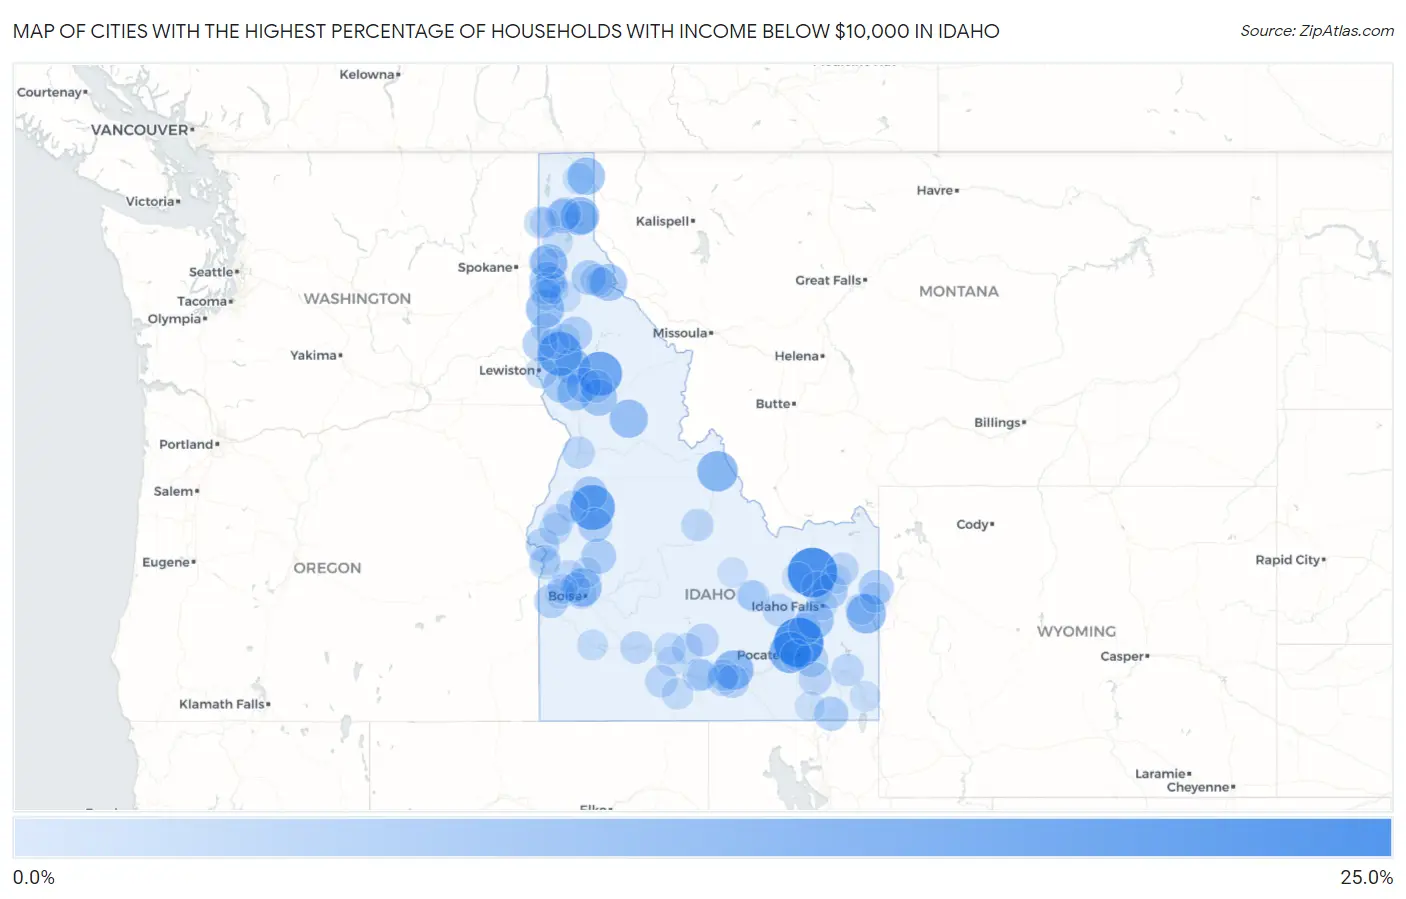
Map of Cities with the Highest Percentage of Households with Income Below $10,000 in Idaho
0.0%
25.0%
Cities with the Highest Percentage of Households with Income Below $10,000 in Idaho
| City | Households with Income < $10k | vs State | vs National | |
| 1. | Fort Hall | 23.2% | 3.7%(+19.5)#1 | 4.9%(+18.3)#914 |
| 2. | Hamer | 23.1% | 3.7%(+19.4)#2 | 4.9%(+18.2)#936 |
| 3. | Donnelly | 18.4% | 3.7%(+14.7)#3 | 4.9%(+13.5)#1,433 |
| 4. | Weippe | 17.7% | 3.7%(+14.0)#4 | 4.9%(+12.8)#1,536 |
| 5. | Kendrick | 17.5% | 3.7%(+13.8)#5 | 4.9%(+12.6)#1,567 |
| 6. | Silverton | 16.8% | 3.7%(+13.1)#6 | 4.9%(+11.9)#1,699 |
| 7. | Arbon Valley | 14.8% | 3.7%(+11.1)#7 | 4.9%(+9.90)#2,156 |
| 8. | Salmon | 14.1% | 3.7%(+10.4)#8 | 4.9%(+9.20)#2,324 |
| 9. | Irwin | 13.1% | 3.7%(+9.40)#9 | 4.9%(+8.20)#2,687 |
| 10. | Acequia | 13.0% | 3.7%(+9.30)#10 | 4.9%(+8.10)#2,724 |
| 11. | Hope | 12.2% | 3.7%(+8.50)#11 | 4.9%(+7.30)#3,091 |
| 12. | Hidden Springs | 11.9% | 3.7%(+8.20)#12 | 4.9%(+7.00)#3,210 |
| 13. | Tensed | 11.9% | 3.7%(+8.20)#13 | 4.9%(+7.00)#3,257 |
| 14. | Elk City | 11.7% | 3.7%(+8.00)#14 | 4.9%(+6.80)#3,355 |
| 15. | Moyie Springs | 11.1% | 3.7%(+7.40)#15 | 4.9%(+6.20)#3,657 |
| 16. | Firth | 11.1% | 3.7%(+7.40)#16 | 4.9%(+6.20)#3,668 |
| 17. | Mullan | 10.6% | 3.7%(+6.90)#17 | 4.9%(+5.70)#4,009 |
| 18. | Stites | 10.3% | 3.7%(+6.60)#18 | 4.9%(+5.40)#4,219 |
| 19. | Huetter | 10.3% | 3.7%(+6.60)#19 | 4.9%(+5.40)#4,221 |
| 20. | Peck | 9.8% | 3.7%(+6.10)#20 | 4.9%(+4.90)#4,586 |
| 21. | Ferdinand | 9.7% | 3.7%(+6.00)#21 | 4.9%(+4.80)#4,661 |
| 22. | Rockford Bay | 9.4% | 3.7%(+5.70)#22 | 4.9%(+4.50)#4,902 |
| 23. | Winchester | 8.9% | 3.7%(+5.20)#23 | 4.9%(+4.00)#5,398 |
| 24. | Moscow | 8.7% | 3.7%(+5.00)#24 | 4.9%(+3.80)#5,534 |
| 25. | Crouch | 8.7% | 3.7%(+5.00)#25 | 4.9%(+3.80)#5,633 |
| 26. | Rigby | 8.6% | 3.7%(+4.90)#26 | 4.9%(+3.70)#5,669 |
| 27. | Driggs | 8.5% | 3.7%(+4.80)#27 | 4.9%(+3.60)#5,792 |
| 28. | Mccall | 8.4% | 3.7%(+4.70)#28 | 4.9%(+3.50)#5,902 |
| 29. | Kellogg | 8.4% | 3.7%(+4.70)#29 | 4.9%(+3.50)#5,911 |
| 30. | Nezperce | 8.3% | 3.7%(+4.60)#30 | 4.9%(+3.40)#6,060 |
| 31. | Bovill | 8.2% | 3.7%(+4.50)#31 | 4.9%(+3.30)#6,192 |
| 32. | Preston | 8.1% | 3.7%(+4.40)#32 | 4.9%(+3.20)#6,231 |
| 33. | Cascade | 8.1% | 3.7%(+4.40)#33 | 4.9%(+3.20)#6,264 |
| 34. | Dover | 7.8% | 3.7%(+4.10)#34 | 4.9%(+2.90)#6,658 |
| 35. | Inkom | 7.7% | 3.7%(+4.00)#35 | 4.9%(+2.80)#6,777 |
| 36. | Marsing | 7.6% | 3.7%(+3.90)#36 | 4.9%(+2.70)#6,924 |
| 37. | Weiser | 7.4% | 3.7%(+3.70)#37 | 4.9%(+2.50)#7,185 |
| 38. | East Hope | 7.1% | 3.7%(+3.40)#38 | 4.9%(+2.20)#7,731 |
| 39. | Declo | 7.0% | 3.7%(+3.30)#39 | 4.9%(+2.10)#7,853 |
| 40. | Richfield | 6.8% | 3.7%(+3.10)#40 | 4.9%(+1.90)#8,197 |
| 41. | Arimo | 6.8% | 3.7%(+3.10)#41 | 4.9%(+1.90)#8,208 |
| 42. | Sandpoint | 6.7% | 3.7%(+3.00)#42 | 4.9%(+1.80)#8,262 |
| 43. | Kamiah | 6.7% | 3.7%(+3.00)#43 | 4.9%(+1.80)#8,312 |
| 44. | Eden | 6.4% | 3.7%(+2.70)#44 | 4.9%(+1.50)#8,846 |
| 45. | Soda Springs | 6.3% | 3.7%(+2.60)#45 | 4.9%(+1.40)#8,939 |
| 46. | Challis | 6.3% | 3.7%(+2.60)#46 | 4.9%(+1.40)#8,987 |
| 47. | Castleford | 6.3% | 3.7%(+2.60)#47 | 4.9%(+1.40)#9,042 |
| 48. | Atomic City | 6.3% | 3.7%(+2.60)#48 | 4.9%(+1.40)#9,069 |
| 49. | St Anthony | 6.1% | 3.7%(+2.40)#49 | 4.9%(+1.20)#9,303 |
| 50. | Glenns Ferry | 6.1% | 3.7%(+2.40)#50 | 4.9%(+1.20)#9,360 |
| 51. | Riggins | 6.1% | 3.7%(+2.40)#51 | 4.9%(+1.20)#9,423 |
| 52. | Blackfoot | 6.0% | 3.7%(+2.30)#52 | 4.9%(+1.10)#9,489 |
| 53. | Osburn | 6.0% | 3.7%(+2.30)#53 | 4.9%(+1.10)#9,564 |
| 54. | Oldtown | 6.0% | 3.7%(+2.30)#54 | 4.9%(+1.10)#9,617 |
| 55. | Roberts | 6.0% | 3.7%(+2.30)#55 | 4.9%(+1.10)#9,620 |
| 56. | Council | 5.9% | 3.7%(+2.20)#56 | 4.9%(+1.00)#9,805 |
| 57. | Emmett | 5.8% | 3.7%(+2.10)#57 | 4.9%(+0.900)#9,912 |
| 58. | Harrison | 5.8% | 3.7%(+2.10)#58 | 4.9%(+0.900)#10,048 |
| 59. | Midvale | 5.8% | 3.7%(+2.10)#59 | 4.9%(+0.900)#10,049 |
| 60. | Lewiston | 5.7% | 3.7%(+2.00)#60 | 4.9%(+0.800)#10,080 |
| 61. | Burley | 5.7% | 3.7%(+2.00)#61 | 4.9%(+0.800)#10,095 |
| 62. | Cambridge | 5.7% | 3.7%(+2.00)#62 | 4.9%(+0.800)#10,254 |
| 63. | Swan Valley | 5.6% | 3.7%(+1.90)#63 | 4.9%(+0.700)#10,474 |
| 64. | Gooding | 5.5% | 3.7%(+1.80)#64 | 4.9%(+0.600)#10,587 |
| 65. | St Maries | 5.5% | 3.7%(+1.80)#65 | 4.9%(+0.600)#10,609 |
| 66. | Shoshone | 5.5% | 3.7%(+1.80)#66 | 4.9%(+0.600)#10,628 |
| 67. | Paul | 5.5% | 3.7%(+1.80)#67 | 4.9%(+0.600)#10,638 |
| 68. | Worley | 5.5% | 3.7%(+1.80)#68 | 4.9%(+0.600)#10,701 |
| 69. | Butte City | 5.5% | 3.7%(+1.80)#69 | 4.9%(+0.600)#10,712 |
| 70. | Fruitland | 5.4% | 3.7%(+1.70)#70 | 4.9%(+0.500)#10,774 |
| 71. | Bonners Ferry | 5.4% | 3.7%(+1.70)#71 | 4.9%(+0.500)#10,814 |
| 72. | Hollister | 5.3% | 3.7%(+1.60)#72 | 4.9%(+0.400)#11,105 |
| 73. | Pocatello | 5.2% | 3.7%(+1.50)#73 | 4.9%(+0.300)#11,162 |
| 74. | Hazelton | 5.2% | 3.7%(+1.50)#74 | 4.9%(+0.300)#11,316 |
| 75. | Potlatch | 5.1% | 3.7%(+1.40)#75 | 4.9%(+0.200)#11,566 |
| 76. | Garden City | 5.0% | 3.7%(+1.30)#76 | 4.9%(+0.100)#11,689 |
| 77. | Grand View | 4.9% | 3.7%(+1.20)#77 | 4.9%(=0.000)#12,071 |
| 78. | Montpelier | 4.8% | 3.7%(+1.10)#78 | 4.9%(-0.100)#12,223 |
| 79. | Plummer | 4.8% | 3.7%(+1.10)#79 | 4.9%(-0.100)#12,272 |
| 80. | Horseshoe Bend | 4.8% | 3.7%(+1.10)#80 | 4.9%(-0.100)#12,299 |
| 81. | Victor | 4.7% | 3.7%(+1.000)#81 | 4.9%(-0.200)#12,497 |
| 82. | Priest River | 4.7% | 3.7%(+1.000)#82 | 4.9%(-0.200)#12,512 |
| 83. | Wallace | 4.7% | 3.7%(+1.000)#83 | 4.9%(-0.200)#12,560 |
| 84. | Troy | 4.7% | 3.7%(+1.000)#84 | 4.9%(-0.200)#12,572 |
| 85. | Mud Lake | 4.7% | 3.7%(+1.000)#85 | 4.9%(-0.200)#12,602 |
| 86. | Payette | 4.5% | 3.7%(+0.800)#86 | 4.9%(-0.400)#12,974 |
| 87. | Athol | 4.5% | 3.7%(+0.800)#87 | 4.9%(-0.400)#13,086 |
| 88. | Conkling Park | 4.5% | 3.7%(+0.800)#88 | 4.9%(-0.400)#13,148 |
| 89. | Rexburg | 4.4% | 3.7%(+0.700)#89 | 4.9%(-0.500)#13,185 |
| 90. | Deary | 4.4% | 3.7%(+0.700)#90 | 4.9%(-0.500)#13,362 |
| 91. | Caldwell | 4.3% | 3.7%(+0.600)#91 | 4.9%(-0.600)#13,424 |
| 92. | Coeur D Alene | 4.3% | 3.7%(+0.600)#92 | 4.9%(-0.600)#13,427 |
| 93. | Eagle | 4.3% | 3.7%(+0.600)#93 | 4.9%(-0.600)#13,441 |
| 94. | Middleton | 4.3% | 3.7%(+0.600)#94 | 4.9%(-0.600)#13,485 |
| 95. | Arco | 4.3% | 3.7%(+0.600)#95 | 4.9%(-0.600)#13,632 |
| 96. | Mackay | 4.3% | 3.7%(+0.600)#96 | 4.9%(-0.600)#13,647 |
| 97. | Idaho Falls | 4.2% | 3.7%(+0.500)#97 | 4.9%(-0.700)#13,720 |
| 98. | Post Falls | 4.2% | 3.7%(+0.500)#98 | 4.9%(-0.700)#13,729 |
| 99. | Wendell | 4.1% | 3.7%(+0.400)#99 | 4.9%(-0.800)#14,102 |
| 100. | Malad City | 4.1% | 3.7%(+0.400)#100 | 4.9%(-0.800)#14,128 |
Common Questions
What are the Top 10 Cities with the Highest Percentage of Households with Income Below $10,000 in Idaho?
Top 10 Cities with the Highest Percentage of Households with Income Below $10,000 in Idaho are:
What city has the Highest Percentage of Households with Income Below $10,000 in Idaho?
Fort Hall has the Highest Percentage of Households with Income Below $10,000 in Idaho with 23.2%.
What is the Percentage of Households with Income Below $10,000 in the State of Idaho?
Percentage of Households with Income Below $10,000 in Idaho is 3.7%.
What is the Percentage of Households with Income Below $10,000 in the United States?
Percentage of Households with Income Below $10,000 in the United States is 4.9%.