Cities with the Highest Percentage of Households with Income Below $10,000 in Oklahoma
RELATED REPORTS & OPTIONS
Household Income | $0-10k
Oklahoma
Compare Cities
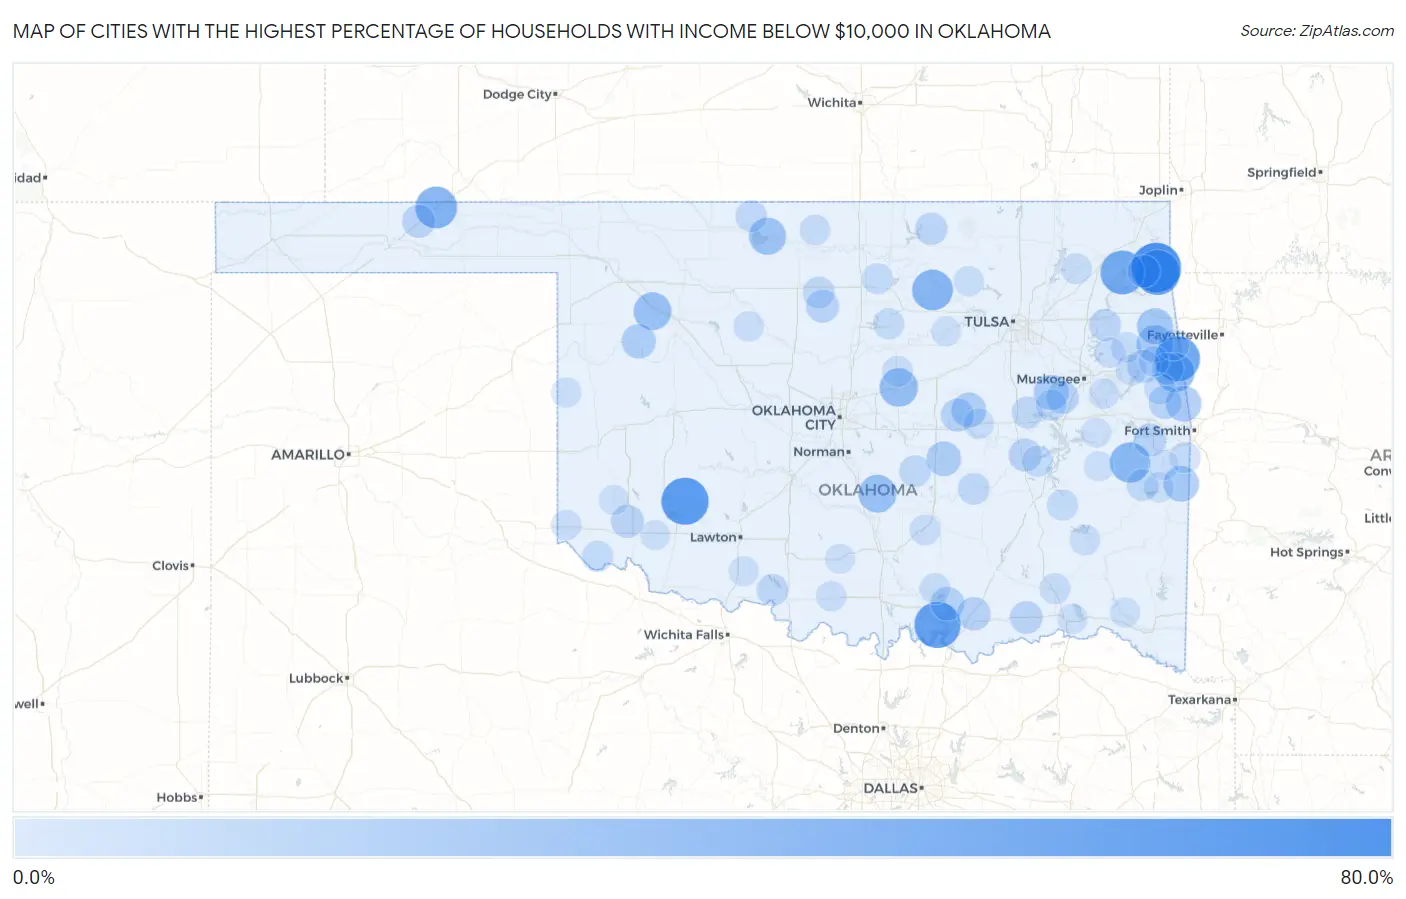
Map of Cities with the Highest Percentage of Households with Income Below $10,000 in Oklahoma
0.0%
80.0%
Cities with the Highest Percentage of Households with Income Below $10,000 in Oklahoma
| City | Households with Income < $10k | vs State | vs National | |
| 1. | Butler | 66.7% | 5.6%(+61.1)#1 | 4.9%(+61.8)#78 |
| 2. | Cooperton | 60.0% | 5.6%(+54.4)#2 | 4.9%(+55.1)#106 |
| 3. | New Woodville | 57.1% | 5.6%(+51.5)#3 | 4.9%(+52.2)#121 |
| 4. | Mcbride | 55.6% | 5.6%(+50.0)#4 | 4.9%(+50.7)#129 |
| 5. | White Water | 54.1% | 5.6%(+48.5)#5 | 4.9%(+49.2)#137 |
| 6. | Piney | 53.8% | 5.6%(+48.2)#6 | 4.9%(+48.9)#139 |
| 7. | Grand Lake Towne | 50.8% | 5.6%(+45.2)#7 | 4.9%(+45.9)#156 |
| 8. | Tyrone | 44.5% | 5.6%(+38.9)#8 | 4.9%(+39.6)#228 |
| 9. | Skedee | 41.7% | 5.6%(+36.1)#9 | 4.9%(+36.8)#268 |
| 10. | Mccurtain | 40.2% | 5.6%(+34.6)#10 | 4.9%(+35.3)#292 |
| 11. | Elm Grove | 37.0% | 5.6%(+31.4)#11 | 4.9%(+32.1)#349 |
| 12. | Warwick | 35.1% | 5.6%(+29.5)#12 | 4.9%(+30.2)#398 |
| 13. | Rosedale | 33.3% | 5.6%(+27.7)#13 | 4.9%(+28.4)#454 |
| 14. | Mutual | 33.3% | 5.6%(+27.7)#14 | 4.9%(+28.4)#455 |
| 15. | Nescatunga | 31.3% | 5.6%(+25.7)#15 | 4.9%(+26.4)#504 |
| 16. | Proctor | 30.6% | 5.6%(+25.0)#16 | 4.9%(+25.7)#529 |
| 17. | Bache | 28.6% | 5.6%(+23.0)#17 | 4.9%(+23.7)#618 |
| 18. | Chewey | 28.4% | 5.6%(+22.8)#18 | 4.9%(+23.5)#623 |
| 19. | Monroe | 27.5% | 5.6%(+21.9)#19 | 4.9%(+22.6)#665 |
| 20. | Short | 27.3% | 5.6%(+21.7)#20 | 4.9%(+22.4)#671 |
| 21. | Boynton | 25.7% | 5.6%(+20.1)#21 | 4.9%(+20.8)#753 |
| 22. | Washita | 25.7% | 5.6%(+20.1)#22 | 4.9%(+20.8)#754 |
| 23. | Sportmans Shores | 25.3% | 5.6%(+19.7)#23 | 4.9%(+20.4)#773 |
| 24. | Lima | 25.0% | 5.6%(+19.4)#24 | 4.9%(+20.1)#795 |
| 25. | Ixl | 25.0% | 5.6%(+19.4)#25 | 4.9%(+20.1)#804 |
| 26. | Lake Ellsworth Addition | 24.7% | 5.6%(+19.1)#26 | 4.9%(+19.8)#818 |
| 27. | Camargo | 24.0% | 5.6%(+18.4)#27 | 4.9%(+19.1)#863 |
| 28. | Bee | 22.2% | 5.6%(+16.6)#28 | 4.9%(+17.3)#1,000 |
| 29. | Sparrowhawk | 21.9% | 5.6%(+16.3)#29 | 4.9%(+17.0)#1,023 |
| 30. | Armstrong | 21.3% | 5.6%(+15.7)#30 | 4.9%(+16.4)#1,087 |
| 31. | Boley | 20.8% | 5.6%(+15.2)#31 | 4.9%(+15.9)#1,122 |
| 32. | Pumpkin Hollow | 20.8% | 5.6%(+15.2)#32 | 4.9%(+15.9)#1,128 |
| 33. | Stoney Point | 20.7% | 5.6%(+15.1)#33 | 4.9%(+15.8)#1,136 |
| 34. | Hooker | 20.1% | 5.6%(+14.5)#34 | 4.9%(+15.2)#1,182 |
| 35. | Caney | 20.0% | 5.6%(+14.4)#35 | 4.9%(+15.1)#1,197 |
| 36. | Martha | 20.0% | 5.6%(+14.4)#36 | 4.9%(+15.1)#1,208 |
| 37. | Cowlington | 20.0% | 5.6%(+14.4)#37 | 4.9%(+15.1)#1,211 |
| 38. | Hanna | 20.0% | 5.6%(+14.4)#38 | 4.9%(+15.1)#1,213 |
| 39. | Douglas | 20.0% | 5.6%(+14.4)#39 | 4.9%(+15.1)#1,220 |
| 40. | Keefton | 19.4% | 5.6%(+13.8)#40 | 4.9%(+14.5)#1,287 |
| 41. | Wainwright | 19.4% | 5.6%(+13.8)#41 | 4.9%(+14.5)#1,295 |
| 42. | Boswell | 19.3% | 5.6%(+13.7)#42 | 4.9%(+14.4)#1,301 |
| 43. | Zena | 19.0% | 5.6%(+13.4)#43 | 4.9%(+14.1)#1,349 |
| 44. | Canadian Shores | 18.6% | 5.6%(+13.0)#44 | 4.9%(+13.7)#1,410 |
| 45. | Briartown | 18.2% | 5.6%(+12.6)#45 | 4.9%(+13.3)#1,464 |
| 46. | Webb City | 18.2% | 5.6%(+12.6)#46 | 4.9%(+13.3)#1,467 |
| 47. | Cedar Crest | 17.8% | 5.6%(+12.2)#47 | 4.9%(+12.9)#1,527 |
| 48. | Fairmont | 17.4% | 5.6%(+11.8)#48 | 4.9%(+12.5)#1,581 |
| 49. | Cottonwood | 17.3% | 5.6%(+11.7)#49 | 4.9%(+12.4)#1,603 |
| 50. | Stilwell | 17.0% | 5.6%(+11.4)#50 | 4.9%(+12.1)#1,637 |
| 51. | Grayson | 17.0% | 5.6%(+11.4)#51 | 4.9%(+12.1)#1,656 |
| 52. | Fanshawe | 16.8% | 5.6%(+11.2)#52 | 4.9%(+11.9)#1,703 |
| 53. | Hastings | 16.7% | 5.6%(+11.1)#53 | 4.9%(+11.8)#1,726 |
| 54. | Atwood | 16.7% | 5.6%(+11.1)#54 | 4.9%(+11.8)#1,731 |
| 55. | St Louis | 16.7% | 5.6%(+11.1)#55 | 4.9%(+11.8)#1,733 |
| 56. | Caney Ridge | 16.7% | 5.6%(+11.1)#56 | 4.9%(+11.8)#1,736 |
| 57. | Byron | 16.7% | 5.6%(+11.1)#57 | 4.9%(+11.8)#1,751 |
| 58. | Honey Hill | 16.4% | 5.6%(+10.8)#58 | 4.9%(+11.5)#1,796 |
| 59. | Hodgen | 16.0% | 5.6%(+10.4)#59 | 4.9%(+11.1)#1,874 |
| 60. | Hartshorne | 15.4% | 5.6%(+9.80)#60 | 4.9%(+10.5)#1,994 |
| 61. | Eldorado | 15.4% | 5.6%(+9.80)#61 | 4.9%(+10.5)#2,007 |
| 62. | Indianola | 15.4% | 5.6%(+9.80)#62 | 4.9%(+10.5)#2,012 |
| 63. | Stillwater | 15.2% | 5.6%(+9.60)#63 | 4.9%(+10.3)#2,041 |
| 64. | Council Hill | 15.2% | 5.6%(+9.60)#64 | 4.9%(+10.3)#2,059 |
| 65. | Greasy | 15.1% | 5.6%(+9.50)#65 | 4.9%(+10.2)#2,072 |
| 66. | Rock Island | 14.9% | 5.6%(+9.30)#66 | 4.9%(+10.00)#2,123 |
| 67. | Red Rock | 14.9% | 5.6%(+9.30)#67 | 4.9%(+10.00)#2,132 |
| 68. | Tishomingo | 14.7% | 5.6%(+9.10)#68 | 4.9%(+9.80)#2,176 |
| 69. | Antlers | 14.7% | 5.6%(+9.10)#69 | 4.9%(+9.80)#2,177 |
| 70. | Chelsea | 14.7% | 5.6%(+9.10)#70 | 4.9%(+9.80)#2,178 |
| 71. | Westville | 14.7% | 5.6%(+9.10)#71 | 4.9%(+9.80)#2,179 |
| 72. | Keys | 14.7% | 5.6%(+9.10)#72 | 4.9%(+9.80)#2,182 |
| 73. | Grandview | 14.4% | 5.6%(+8.80)#73 | 4.9%(+9.50)#2,250 |
| 74. | Shady Grove Cdp Mcintosh County | 14.4% | 5.6%(+8.80)#74 | 4.9%(+9.50)#2,255 |
| 75. | Fitzhugh | 14.3% | 5.6%(+8.70)#75 | 4.9%(+9.40)#2,276 |
| 76. | Carney | 14.1% | 5.6%(+8.50)#76 | 4.9%(+9.20)#2,339 |
| 77. | Medford | 14.0% | 5.6%(+8.40)#77 | 4.9%(+9.10)#2,365 |
| 78. | Okemah | 13.9% | 5.6%(+8.30)#78 | 4.9%(+9.00)#2,387 |
| 79. | Clayton | 13.7% | 5.6%(+8.10)#79 | 4.9%(+8.80)#2,461 |
| 80. | Okeene | 13.5% | 5.6%(+7.90)#80 | 4.9%(+8.60)#2,520 |
| 81. | Wauhillau | 13.4% | 5.6%(+7.80)#81 | 4.9%(+8.50)#2,556 |
| 82. | Sand Hill | 13.4% | 5.6%(+7.80)#82 | 4.9%(+8.50)#2,557 |
| 83. | Hollis | 13.3% | 5.6%(+7.70)#83 | 4.9%(+8.40)#2,580 |
| 84. | Ringling | 13.3% | 5.6%(+7.70)#84 | 4.9%(+8.40)#2,589 |
| 85. | Bunch | 13.3% | 5.6%(+7.70)#85 | 4.9%(+8.40)#2,618 |
| 86. | Hulbert | 13.1% | 5.6%(+7.50)#86 | 4.9%(+8.20)#2,680 |
| 87. | Hominy | 13.0% | 5.6%(+7.40)#87 | 4.9%(+8.10)#2,698 |
| 88. | Hugo | 12.9% | 5.6%(+7.30)#88 | 4.9%(+8.00)#2,739 |
| 89. | Walters | 12.9% | 5.6%(+7.30)#89 | 4.9%(+8.00)#2,747 |
| 90. | Whippoorwill | 12.9% | 5.6%(+7.30)#90 | 4.9%(+8.00)#2,775 |
| 91. | Wister | 12.8% | 5.6%(+7.20)#91 | 4.9%(+7.90)#2,792 |
| 92. | Porum | 12.8% | 5.6%(+7.20)#92 | 4.9%(+7.90)#2,794 |
| 93. | Reydon | 12.7% | 5.6%(+7.10)#93 | 4.9%(+7.80)#2,841 |
| 94. | Shady Point | 12.6% | 5.6%(+7.00)#94 | 4.9%(+7.70)#2,858 |
| 95. | Oilton | 12.6% | 5.6%(+7.00)#95 | 4.9%(+7.70)#2,859 |
| 96. | Wright City | 12.6% | 5.6%(+7.00)#96 | 4.9%(+7.70)#2,864 |
| 97. | Kinta | 12.6% | 5.6%(+7.00)#97 | 4.9%(+7.70)#2,879 |
| 98. | Mangum | 12.5% | 5.6%(+6.90)#98 | 4.9%(+7.60)#2,902 |
| 99. | Ratliff City | 12.5% | 5.6%(+6.90)#99 | 4.9%(+7.60)#2,938 |
| 100. | Headrick | 12.5% | 5.6%(+6.90)#100 | 4.9%(+7.60)#2,940 |
Common Questions
What are the Top 10 Cities with the Highest Percentage of Households with Income Below $10,000 in Oklahoma?
Top 10 Cities with the Highest Percentage of Households with Income Below $10,000 in Oklahoma are:
#1
66.7%
#2
60.0%
#3
57.1%
#4
54.1%
#5
53.8%
#6
50.8%
#7
44.5%
#8
41.7%
#9
40.2%
#10
37.0%
What city has the Highest Percentage of Households with Income Below $10,000 in Oklahoma?
Butler has the Highest Percentage of Households with Income Below $10,000 in Oklahoma with 66.7%.
What is the Percentage of Households with Income Below $10,000 in the State of Oklahoma?
Percentage of Households with Income Below $10,000 in Oklahoma is 5.6%.
What is the Percentage of Households with Income Below $10,000 in the United States?
Percentage of Households with Income Below $10,000 in the United States is 4.9%.