Cities with the Highest Percentage of Households with Income Below $10,000 in Wyoming
RELATED REPORTS & OPTIONS
Household Income | $0-10k
Wyoming
Compare Cities
Map of Cities with the Highest Percentage of Households with Income Below $10,000 in Wyoming
0.0%
100.0%
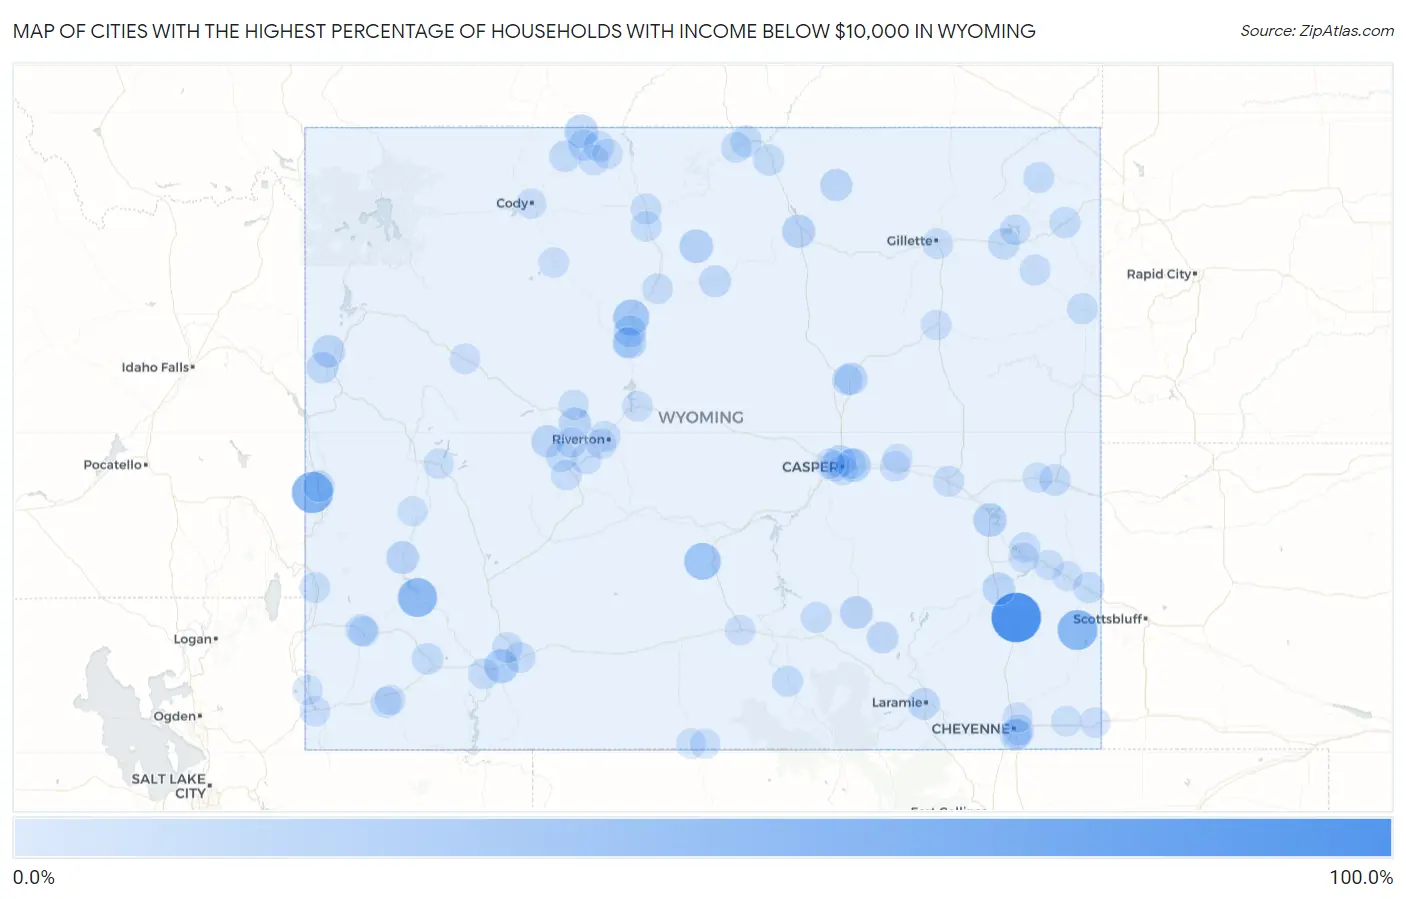
Cities with the Highest Percentage of Households with Income Below $10,000 in Wyoming
| City | Households with Income < $10k | vs State | vs National | |
| 1. | Slater | 100.0% | 4.6%(+95.4)#1 | 4.9%(+95.1)#11 |
| 2. | Fairview | 56.5% | 4.6%(+51.9)#2 | 4.9%(+51.6)#122 |
| 3. | Hawk Springs | 50.0% | 4.6%(+45.4)#3 | 4.9%(+45.1)#169 |
| 4. | Fontenelle | 45.7% | 4.6%(+41.1)#4 | 4.9%(+40.8)#215 |
| 5. | El Rancho | 45.5% | 4.6%(+40.9)#5 | 4.9%(+40.6)#217 |
| 6. | Bairoil | 33.3% | 4.6%(+28.7)#6 | 4.9%(+28.4)#445 |
| 7. | Kirby | 29.6% | 4.6%(+25.0)#7 | 4.9%(+24.7)#573 |
| 8. | Purple Sage | 20.1% | 4.6%(+15.5)#8 | 4.9%(+15.2)#1,185 |
| 9. | Brookhurst | 18.5% | 4.6%(+13.9)#9 | 4.9%(+13.6)#1,421 |
| 10. | Hyattville | 18.2% | 4.6%(+13.6)#10 | 4.9%(+13.3)#1,468 |
| 11. | Frannie | 17.3% | 4.6%(+12.7)#11 | 4.9%(+12.4)#1,602 |
| 12. | Glendo | 17.2% | 4.6%(+12.6)#12 | 4.9%(+12.3)#1,615 |
| 13. | Buffalo | 15.9% | 4.6%(+11.3)#13 | 4.9%(+11.0)#1,877 |
| 14. | La Barge | 14.7% | 4.6%(+10.1)#14 | 4.9%(+9.80)#2,194 |
| 15. | Medicine Bow | 14.0% | 4.6%(+9.40)#15 | 4.9%(+9.10)#2,373 |
| 16. | East Thermopolis | 13.0% | 4.6%(+8.40)#16 | 4.9%(+8.10)#2,723 |
| 17. | Wheatland | 12.7% | 4.6%(+8.10)#17 | 4.9%(+7.80)#2,817 |
| 18. | Johnstown | 12.2% | 4.6%(+7.60)#18 | 4.9%(+7.30)#3,080 |
| 19. | Edgerton | 12.2% | 4.6%(+7.60)#19 | 4.9%(+7.30)#3,089 |
| 20. | Teton Village | 12.0% | 4.6%(+7.40)#20 | 4.9%(+7.10)#3,169 |
| 21. | Hartrandt | 11.8% | 4.6%(+7.20)#21 | 4.9%(+6.90)#3,288 |
| 22. | Fort Washakie | 11.6% | 4.6%(+7.00)#22 | 4.9%(+6.70)#3,385 |
| 23. | Lucerne | 11.5% | 4.6%(+6.90)#23 | 4.9%(+6.60)#3,452 |
| 24. | Clearmont | 11.4% | 4.6%(+6.80)#24 | 4.9%(+6.50)#3,528 |
| 25. | Laramie | 10.0% | 4.6%(+5.40)#25 | 4.9%(+5.10)#4,367 |
| 26. | Ten Sleep | 9.7% | 4.6%(+5.10)#26 | 4.9%(+4.80)#4,658 |
| 27. | Wilson | 9.3% | 4.6%(+4.70)#27 | 4.9%(+4.40)#4,960 |
| 28. | Rock River | 8.8% | 4.6%(+4.20)#28 | 4.9%(+3.90)#5,509 |
| 29. | Afton | 8.4% | 4.6%(+3.80)#29 | 4.9%(+3.50)#5,910 |
| 30. | Granger | 8.3% | 4.6%(+3.70)#30 | 4.9%(+3.40)#6,080 |
| 31. | Kemmerer | 8.2% | 4.6%(+3.60)#31 | 4.9%(+3.30)#6,133 |
| 32. | Powell | 8.1% | 4.6%(+3.50)#32 | 4.9%(+3.20)#6,229 |
| 33. | Moorcroft | 7.8% | 4.6%(+3.20)#33 | 4.9%(+2.90)#6,655 |
| 34. | Ranchester | 7.6% | 4.6%(+3.00)#34 | 4.9%(+2.70)#6,938 |
| 35. | Sheridan | 6.9% | 4.6%(+2.30)#35 | 4.9%(+2.00)#7,905 |
| 36. | Lusk | 6.9% | 4.6%(+2.30)#36 | 4.9%(+2.00)#7,965 |
| 37. | Deaver | 6.9% | 4.6%(+2.30)#37 | 4.9%(+2.00)#8,040 |
| 38. | Torrington | 6.4% | 4.6%(+1.80)#38 | 4.9%(+1.50)#8,752 |
| 39. | South Greeley | 6.4% | 4.6%(+1.80)#39 | 4.9%(+1.50)#8,768 |
| 40. | Sundance | 6.1% | 4.6%(+1.50)#40 | 4.9%(+1.20)#9,372 |
| 41. | Powder Horn | 6.0% | 4.6%(+1.40)#41 | 4.9%(+1.10)#9,592 |
| 42. | Saratoga | 5.6% | 4.6%(+1.000)#42 | 4.9%(+0.700)#10,387 |
| 43. | Newcastle | 5.5% | 4.6%(+0.900)#43 | 4.9%(+0.600)#10,591 |
| 44. | Boulder Flats | 5.3% | 4.6%(+0.700)#44 | 4.9%(+0.400)#11,093 |
| 45. | Hanna | 5.2% | 4.6%(+0.600)#45 | 4.9%(+0.300)#11,332 |
| 46. | Hulett | 5.2% | 4.6%(+0.600)#46 | 4.9%(+0.300)#11,359 |
| 47. | Douglas | 5.1% | 4.6%(+0.500)#47 | 4.9%(+0.200)#11,462 |
| 48. | Greybull | 5.0% | 4.6%(+0.400)#48 | 4.9%(+0.100)#11,765 |
| 49. | Rock Springs | 4.9% | 4.6%(+0.300)#49 | 4.9%(=0.000)#11,913 |
| 50. | Green River | 4.8% | 4.6%(+0.200)#50 | 4.9%(-0.100)#12,157 |
| 51. | Cokeville | 4.8% | 4.6%(+0.200)#51 | 4.9%(-0.100)#12,332 |
| 52. | Midwest | 4.8% | 4.6%(+0.200)#52 | 4.9%(-0.100)#12,364 |
| 53. | Gillette | 4.7% | 4.6%(+0.100)#53 | 4.9%(-0.200)#12,402 |
| 54. | Upton | 4.5% | 4.6%(-0.100)#54 | 4.9%(-0.400)#13,076 |
| 55. | Dayton | 4.3% | 4.6%(-0.300)#55 | 4.9%(-0.600)#13,620 |
| 56. | Pine Haven | 4.3% | 4.6%(-0.300)#56 | 4.9%(-0.600)#13,652 |
| 57. | Worland | 4.2% | 4.6%(-0.400)#57 | 4.9%(-0.700)#13,804 |
| 58. | North Rock Springs | 4.2% | 4.6%(-0.400)#58 | 4.9%(-0.700)#13,843 |
| 59. | Cowley | 4.2% | 4.6%(-0.400)#59 | 4.9%(-0.700)#13,918 |
| 60. | Casper | 4.1% | 4.6%(-0.500)#60 | 4.9%(-0.800)#14,004 |
| 61. | Cheyenne | 4.0% | 4.6%(-0.600)#61 | 4.9%(-0.900)#14,281 |
| 62. | Urie | 4.0% | 4.6%(-0.600)#62 | 4.9%(-0.900)#14,567 |
| 63. | Riverton | 3.8% | 4.6%(-0.800)#63 | 4.9%(-1.10)#14,884 |
| 64. | Diamondville | 3.8% | 4.6%(-0.800)#64 | 4.9%(-1.10)#15,048 |
| 65. | Hudson | 3.8% | 4.6%(-0.800)#65 | 4.9%(-1.10)#15,070 |
| 66. | Lander | 3.7% | 4.6%(-0.900)#66 | 4.9%(-1.20)#15,195 |
| 67. | Basin | 3.7% | 4.6%(-0.900)#67 | 4.9%(-1.20)#15,296 |
| 68. | Mills | 3.4% | 4.6%(-1.20)#68 | 4.9%(-1.50)#16,139 |
| 69. | Shoshoni | 3.4% | 4.6%(-1.20)#69 | 4.9%(-1.50)#16,250 |
| 70. | Pine Bluffs | 3.3% | 4.6%(-1.30)#70 | 4.9%(-1.60)#16,530 |
| 71. | Ethete | 3.2% | 4.6%(-1.40)#71 | 4.9%(-1.70)#16,833 |
| 72. | Hartville | 3.2% | 4.6%(-1.40)#72 | 4.9%(-1.70)#16,971 |
| 73. | Evansville | 3.0% | 4.6%(-1.60)#73 | 4.9%(-1.90)#17,472 |
| 74. | Byron | 3.0% | 4.6%(-1.60)#74 | 4.9%(-1.90)#17,594 |
| 75. | Fox Farm College | 2.7% | 4.6%(-1.90)#75 | 4.9%(-2.20)#18,432 |
| 76. | Lyman | 2.7% | 4.6%(-1.90)#76 | 4.9%(-2.20)#18,485 |
| 77. | Dubois | 2.7% | 4.6%(-1.90)#77 | 4.9%(-2.20)#18,545 |
| 78. | Evanston | 2.6% | 4.6%(-2.00)#78 | 4.9%(-2.30)#18,703 |
| 79. | Arapahoe | 2.5% | 4.6%(-2.10)#79 | 4.9%(-2.40)#19,160 |
| 80. | Cody | 2.4% | 4.6%(-2.20)#80 | 4.9%(-2.50)#19,378 |
| 81. | Wright | 2.4% | 4.6%(-2.20)#81 | 4.9%(-2.50)#19,493 |
| 82. | Glenrock | 2.3% | 4.6%(-2.30)#82 | 4.9%(-2.60)#19,761 |
| 83. | Fort Laramie | 2.3% | 4.6%(-2.30)#83 | 4.9%(-2.60)#19,925 |
| 84. | Rawlins | 2.2% | 4.6%(-2.40)#84 | 4.9%(-2.70)#20,009 |
| 85. | Ranchettes | 2.2% | 4.6%(-2.40)#85 | 4.9%(-2.70)#20,039 |
| 86. | Guernsey | 2.2% | 4.6%(-2.40)#86 | 4.9%(-2.70)#20,144 |
| 87. | Meeteetse | 2.2% | 4.6%(-2.40)#87 | 4.9%(-2.70)#20,169 |
| 88. | Burns | 2.2% | 4.6%(-2.40)#88 | 4.9%(-2.70)#20,208 |
| 89. | Thermopolis | 2.1% | 4.6%(-2.50)#89 | 4.9%(-2.80)#20,396 |
| 90. | Pavillion | 2.1% | 4.6%(-2.50)#90 | 4.9%(-2.80)#20,537 |
| 91. | Lovell | 2.0% | 4.6%(-2.60)#91 | 4.9%(-2.90)#20,752 |
| 92. | Vista West | 2.0% | 4.6%(-2.60)#92 | 4.9%(-2.90)#20,821 |
| 93. | Pinedale | 1.9% | 4.6%(-2.70)#93 | 4.9%(-3.00)#21,094 |
| 94. | Baggs | 1.7% | 4.6%(-2.90)#94 | 4.9%(-3.20)#21,791 |
| 95. | Lingle | 1.5% | 4.6%(-3.10)#95 | 4.9%(-3.40)#22,350 |
| 96. | Manville | 1.5% | 4.6%(-3.10)#96 | 4.9%(-3.40)#22,378 |
| 97. | Marbleton | 1.4% | 4.6%(-3.20)#97 | 4.9%(-3.50)#22,549 |
| 98. | Dixon | 1.4% | 4.6%(-3.20)#98 | 4.9%(-3.50)#22,644 |
| 99. | Bear River | 1.0% | 4.6%(-3.60)#99 | 4.9%(-3.90)#23,581 |
| 100. | Rolling Hills | 1.0% | 4.6%(-3.60)#100 | 4.9%(-3.90)#23,609 |
1
2Common Questions
What are the Top 10 Cities with the Highest Percentage of Households with Income Below $10,000 in Wyoming?
Top 10 Cities with the Highest Percentage of Households with Income Below $10,000 in Wyoming are:
#1
100.0%
#2
56.5%
#3
50.0%
#4
45.7%
#5
33.3%
#6
29.6%
#7
20.1%
#8
18.5%
#9
18.2%
#10
17.3%
What city has the Highest Percentage of Households with Income Below $10,000 in Wyoming?
Slater has the Highest Percentage of Households with Income Below $10,000 in Wyoming with 100.0%.
What is the Percentage of Households with Income Below $10,000 in the State of Wyoming?
Percentage of Households with Income Below $10,000 in Wyoming is 4.6%.
What is the Percentage of Households with Income Below $10,000 in the United States?
Percentage of Households with Income Below $10,000 in the United States is 4.9%.