Cities with the Highest Percentage of Households with Income Below $10,000 in New Hampshire
RELATED REPORTS & OPTIONS
Household Income | $0-10k
New Hampshire
Compare Cities
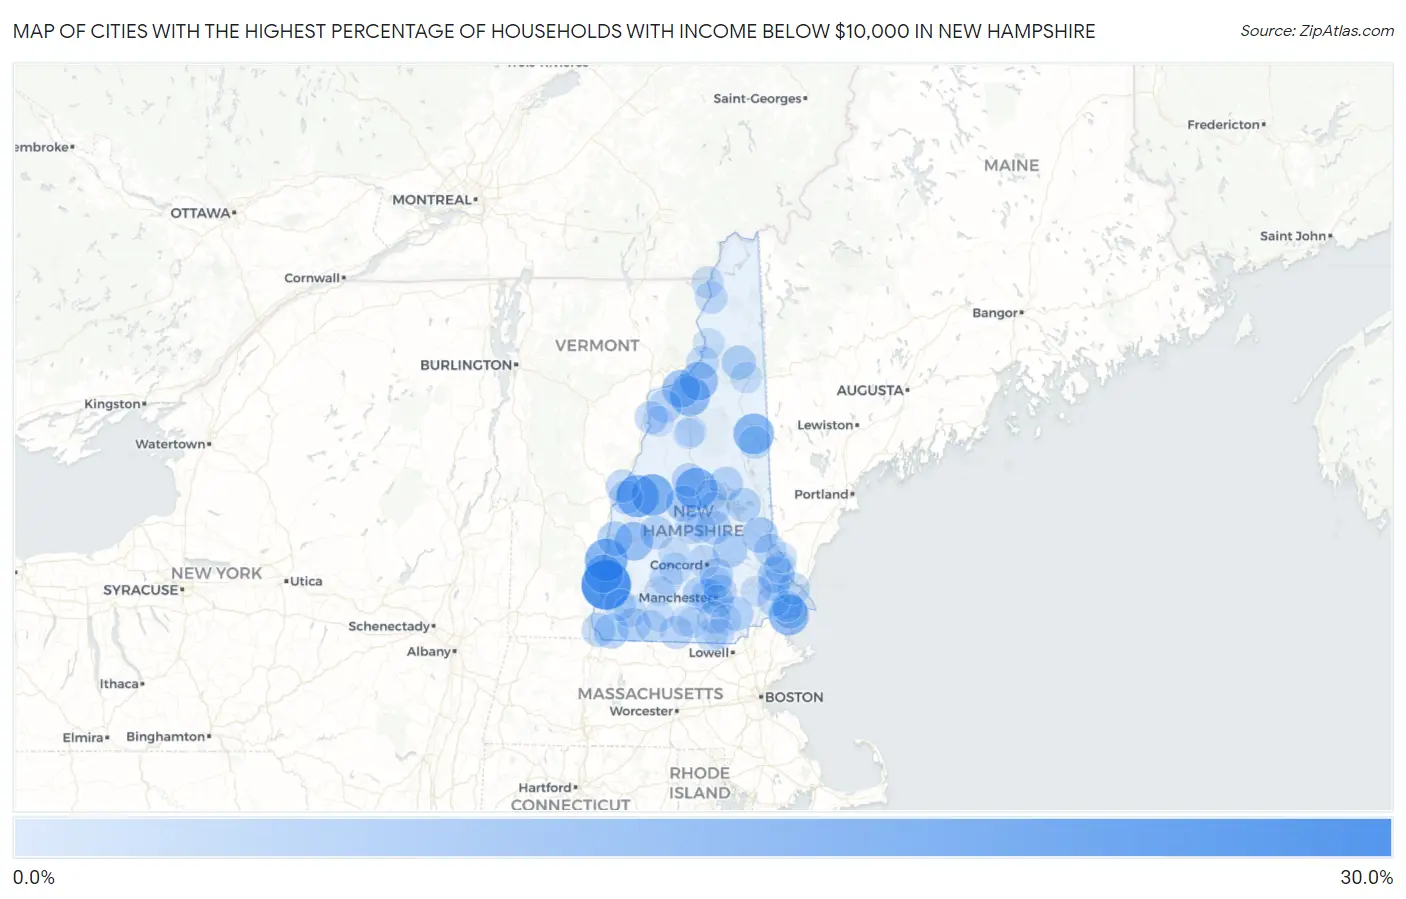
Map of Cities with the Highest Percentage of Households with Income Below $10,000 in New Hampshire
0.0%
30.0%
Cities with the Highest Percentage of Households with Income Below $10,000 in New Hampshire
| City | Households with Income < $10k | vs State | vs National | |
| 1. | Walpole | 26.1% | 2.9%(+23.2)#1 | 4.9%(+21.2)#731 |
| 2. | Charlestown | 16.5% | 2.9%(+13.6)#2 | 4.9%(+11.6)#1,766 |
| 3. | Enfield | 15.9% | 2.9%(+13.0)#3 | 4.9%(+11.0)#1,881 |
| 4. | Ashland | 15.4% | 2.9%(+12.5)#4 | 4.9%(+10.5)#1,995 |
| 5. | Canaan | 15.4% | 2.9%(+12.5)#5 | 4.9%(+10.5)#2,010 |
| 6. | North Conway | 13.8% | 2.9%(+10.9)#6 | 4.9%(+8.90)#2,424 |
| 7. | Seabrook Beach | 13.4% | 2.9%(+10.5)#7 | 4.9%(+8.50)#2,549 |
| 8. | Bethlehem | 12.8% | 2.9%(+9.90)#8 | 4.9%(+7.90)#2,791 |
| 9. | North Walpole | 11.4% | 2.9%(+8.50)#9 | 4.9%(+6.50)#3,516 |
| 10. | Newport | 11.1% | 2.9%(+8.20)#10 | 4.9%(+6.20)#3,643 |
| 11. | Whitefield | 10.9% | 2.9%(+8.00)#11 | 4.9%(+6.00)#3,790 |
| 12. | Littleton | 10.4% | 2.9%(+7.50)#12 | 4.9%(+5.50)#4,096 |
| 13. | Durham | 8.1% | 2.9%(+5.20)#13 | 4.9%(+3.20)#6,216 |
| 14. | Bristol | 7.7% | 2.9%(+4.80)#14 | 4.9%(+2.80)#6,747 |
| 15. | Farmington | 7.6% | 2.9%(+4.70)#15 | 4.9%(+2.70)#6,886 |
| 16. | Pittsfield | 6.4% | 2.9%(+3.50)#16 | 4.9%(+1.50)#8,798 |
| 17. | Claremont | 6.2% | 2.9%(+3.30)#17 | 4.9%(+1.30)#9,097 |
| 18. | Hampton Beach | 6.2% | 2.9%(+3.30)#18 | 4.9%(+1.30)#9,144 |
| 19. | Winchester | 6.2% | 2.9%(+3.30)#19 | 4.9%(+1.30)#9,167 |
| 20. | Belmont | 5.7% | 2.9%(+2.80)#20 | 4.9%(+0.800)#10,193 |
| 21. | Derry | 5.6% | 2.9%(+2.70)#21 | 4.9%(+0.700)#10,295 |
| 22. | Wolfeboro | 5.4% | 2.9%(+2.50)#22 | 4.9%(+0.500)#10,808 |
| 23. | Berlin | 5.3% | 2.9%(+2.40)#23 | 4.9%(+0.400)#10,961 |
| 24. | Pinardville | 5.3% | 2.9%(+2.40)#24 | 4.9%(+0.400)#10,985 |
| 25. | Goffstown | 5.1% | 2.9%(+2.20)#25 | 4.9%(+0.200)#11,495 |
| 26. | Hinsdale | 5.1% | 2.9%(+2.20)#26 | 4.9%(+0.200)#11,531 |
| 27. | Troy | 5.1% | 2.9%(+2.20)#27 | 4.9%(+0.200)#11,559 |
| 28. | Suissevale | 5.1% | 2.9%(+2.20)#28 | 4.9%(+0.200)#11,602 |
| 29. | Plymouth | 4.8% | 2.9%(+1.90)#29 | 4.9%(-0.100)#12,200 |
| 30. | New London | 4.7% | 2.9%(+1.80)#30 | 4.9%(-0.200)#12,542 |
| 31. | Lisbon | 4.6% | 2.9%(+1.70)#31 | 4.9%(-0.300)#12,834 |
| 32. | Lebanon | 4.5% | 2.9%(+1.60)#32 | 4.9%(-0.400)#12,945 |
| 33. | Hanover | 4.5% | 2.9%(+1.60)#33 | 4.9%(-0.400)#12,972 |
| 34. | Suncook | 4.5% | 2.9%(+1.60)#34 | 4.9%(-0.400)#12,998 |
| 35. | South Hooksett | 4.3% | 2.9%(+1.40)#35 | 4.9%(-0.600)#13,508 |
| 36. | Woodsville | 4.1% | 2.9%(+1.20)#36 | 4.9%(-0.800)#14,164 |
| 37. | Greenville | 4.0% | 2.9%(+1.10)#37 | 4.9%(-0.900)#14,485 |
| 38. | Laconia | 3.9% | 2.9%(+1.00)#38 | 4.9%(-1.00)#14,627 |
| 39. | Conway | 3.8% | 2.9%(+0.900)#39 | 4.9%(-1.10)#14,932 |
| 40. | Manchester | 3.7% | 2.9%(+0.800)#40 | 4.9%(-1.20)#15,122 |
| 41. | Exeter | 3.6% | 2.9%(+0.700)#41 | 4.9%(-1.30)#15,483 |
| 42. | Lancaster | 3.6% | 2.9%(+0.700)#42 | 4.9%(-1.30)#15,570 |
| 43. | Nashua | 3.5% | 2.9%(+0.600)#43 | 4.9%(-1.40)#15,731 |
| 44. | East Merrimack | 3.5% | 2.9%(+0.600)#44 | 4.9%(-1.40)#15,829 |
| 45. | Hillsborough | 3.5% | 2.9%(+0.600)#45 | 4.9%(-1.40)#15,904 |
| 46. | Concord | 3.3% | 2.9%(+0.400)#46 | 4.9%(-1.60)#16,359 |
| 47. | Franklin | 3.3% | 2.9%(+0.400)#47 | 4.9%(-1.60)#16,417 |
| 48. | Colebrook | 3.3% | 2.9%(+0.400)#48 | 4.9%(-1.60)#16,551 |
| 49. | Rochester | 3.2% | 2.9%(+0.300)#49 | 4.9%(-1.70)#16,677 |
| 50. | Portsmouth | 3.2% | 2.9%(+0.300)#50 | 4.9%(-1.70)#16,696 |
| 51. | Newmarket | 3.1% | 2.9%(+0.200)#51 | 4.9%(-1.80)#17,096 |
| 52. | Francestown | 3.1% | 2.9%(+0.200)#52 | 4.9%(-1.80)#17,323 |
| 53. | Marlborough | 2.9% | 2.9%(=0.000)#53 | 4.9%(-2.00)#17,863 |
| 54. | West Stewartstown | 2.7% | 2.9%(-0.200)#54 | 4.9%(-2.20)#18,575 |
| 55. | Jaffrey | 2.6% | 2.9%(-0.300)#55 | 4.9%(-2.30)#18,779 |
| 56. | Henniker | 2.6% | 2.9%(-0.300)#56 | 4.9%(-2.30)#18,788 |
| 57. | Keene | 2.4% | 2.9%(-0.500)#57 | 4.9%(-2.50)#19,346 |
| 58. | Dover | 2.3% | 2.9%(-0.600)#58 | 4.9%(-2.60)#19,654 |
| 59. | Hooksett | 2.3% | 2.9%(-0.600)#59 | 4.9%(-2.60)#19,722 |
| 60. | Hampton | 2.2% | 2.9%(-0.700)#60 | 4.9%(-2.70)#19,995 |
| 61. | Gorham | 2.2% | 2.9%(-0.700)#61 | 4.9%(-2.70)#20,103 |
| 62. | Somersworth | 1.9% | 2.9%(-1.000)#62 | 4.9%(-3.00)#20,987 |
| 63. | Tilton Northfield | 1.8% | 2.9%(-1.10)#63 | 4.9%(-3.10)#21,375 |
| 64. | Warner | 1.8% | 2.9%(-1.10)#64 | 4.9%(-3.10)#21,477 |
| 65. | Groveton | 1.7% | 2.9%(-1.20)#65 | 4.9%(-3.20)#21,760 |
| 66. | Meredith | 1.5% | 2.9%(-1.40)#66 | 4.9%(-3.40)#22,225 |
| 67. | Peterborough | 1.5% | 2.9%(-1.40)#67 | 4.9%(-3.40)#22,236 |
| 68. | Londonderry | 1.4% | 2.9%(-1.50)#68 | 4.9%(-3.50)#22,422 |
| 69. | Hudson | 1.4% | 2.9%(-1.50)#69 | 4.9%(-3.50)#22,447 |
| 70. | Lincoln | 1.3% | 2.9%(-1.60)#70 | 4.9%(-3.60)#22,848 |
| 71. | Mountain Lakes | 1.3% | 2.9%(-1.60)#71 | 4.9%(-3.60)#22,883 |
| 72. | North Woodstock | 1.3% | 2.9%(-1.60)#72 | 4.9%(-3.60)#22,887 |
| 73. | Milford | 1.2% | 2.9%(-1.70)#73 | 4.9%(-3.70)#22,982 |
| 74. | Epping | 1.2% | 2.9%(-1.70)#74 | 4.9%(-3.70)#23,041 |
| 75. | Wilton | 0.90% | 2.9%(-2.00)#75 | 4.9%(-4.00)#23,798 |
| 76. | Antrim | 0.80% | 2.9%(-2.10)#76 | 4.9%(-4.10)#23,994 |
1
Common Questions
What are the Top 10 Cities with the Highest Percentage of Households with Income Below $10,000 in New Hampshire?
Top 10 Cities with the Highest Percentage of Households with Income Below $10,000 in New Hampshire are:
#1
26.1%
#2
16.5%
#3
15.9%
#4
15.4%
#5
15.4%
#6
13.8%
#7
13.4%
#8
12.8%
#9
11.4%
#10
11.1%
What city has the Highest Percentage of Households with Income Below $10,000 in New Hampshire?
Walpole has the Highest Percentage of Households with Income Below $10,000 in New Hampshire with 26.1%.
What is the Percentage of Households with Income Below $10,000 in the State of New Hampshire?
Percentage of Households with Income Below $10,000 in New Hampshire is 2.9%.
What is the Percentage of Households with Income Below $10,000 in the United States?
Percentage of Households with Income Below $10,000 in the United States is 4.9%.