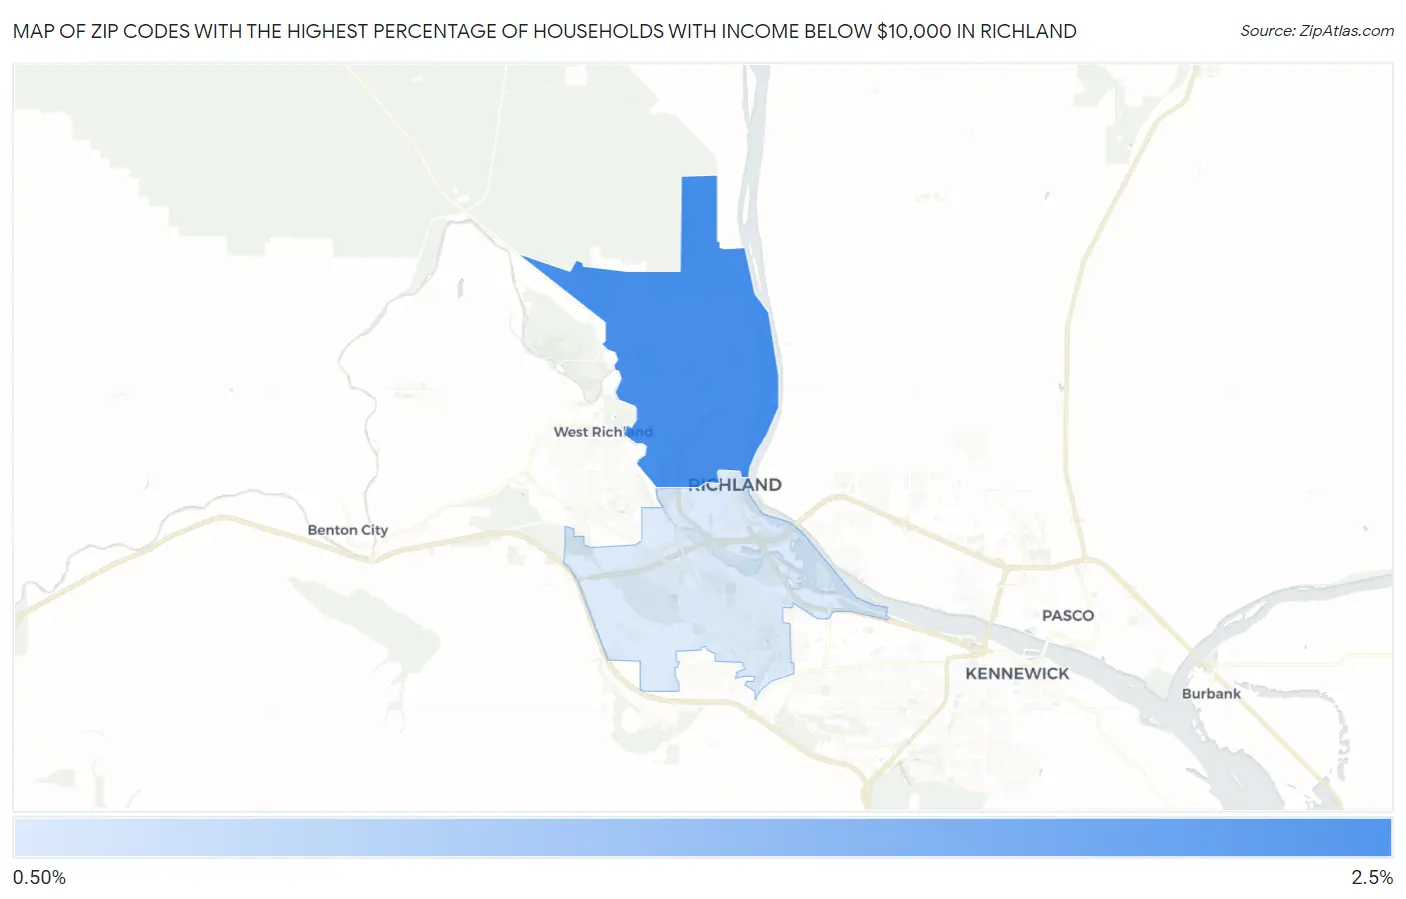
Zip Codes with the Highest Percentage of Households with Income Below $10,000 in Richland, WA
RELATED REPORTS & OPTIONS
Household Income | $0-10k
Richland
Compare Zip Codes
Map of Zip Codes with the Highest Percentage of Households with Income Below $10,000 in Richland
1.2%
2.5%
Zip Codes with the Highest Percentage of Households with Income Below $10,000 in Richland, WA
| Zip Code | Households with Income < $10k | vs State | vs National | |
| 1. | 99354 | 2.5% | 3.7%(-1.20)#370 | 4.9%(-2.40)#21,595 |
| 2. | 99352 | 1.2% | 3.7%(-2.50)#471 | 4.9%(-3.70)#26,289 |
1
Common Questions
What are the Top Zip Codes with the Highest Percentage of Households with Income Below $10,000 in Richland, WA?
Top Zip Codes with the Highest Percentage of Households with Income Below $10,000 in Richland, WA are:
What zip code has the Highest Percentage of Households with Income Below $10,000 in Richland, WA?
99354 has the Highest Percentage of Households with Income Below $10,000 in Richland, WA with 2.5%.
What is the Percentage of Households with Income Below $10,000 in Richland, WA?
Percentage of Households with Income Below $10,000 in Richland is 1.7%.
What is the Percentage of Households with Income Below $10,000 in Washington?
Percentage of Households with Income Below $10,000 in Washington is 3.7%.
What is the Percentage of Households with Income Below $10,000 in the United States?
Percentage of Households with Income Below $10,000 in the United States is 4.9%.