Cities with the Highest Percentage of Households with Income Below $10,000 in Delaware
RELATED REPORTS & OPTIONS
Household Income | $0-10k
Delaware
Compare Cities
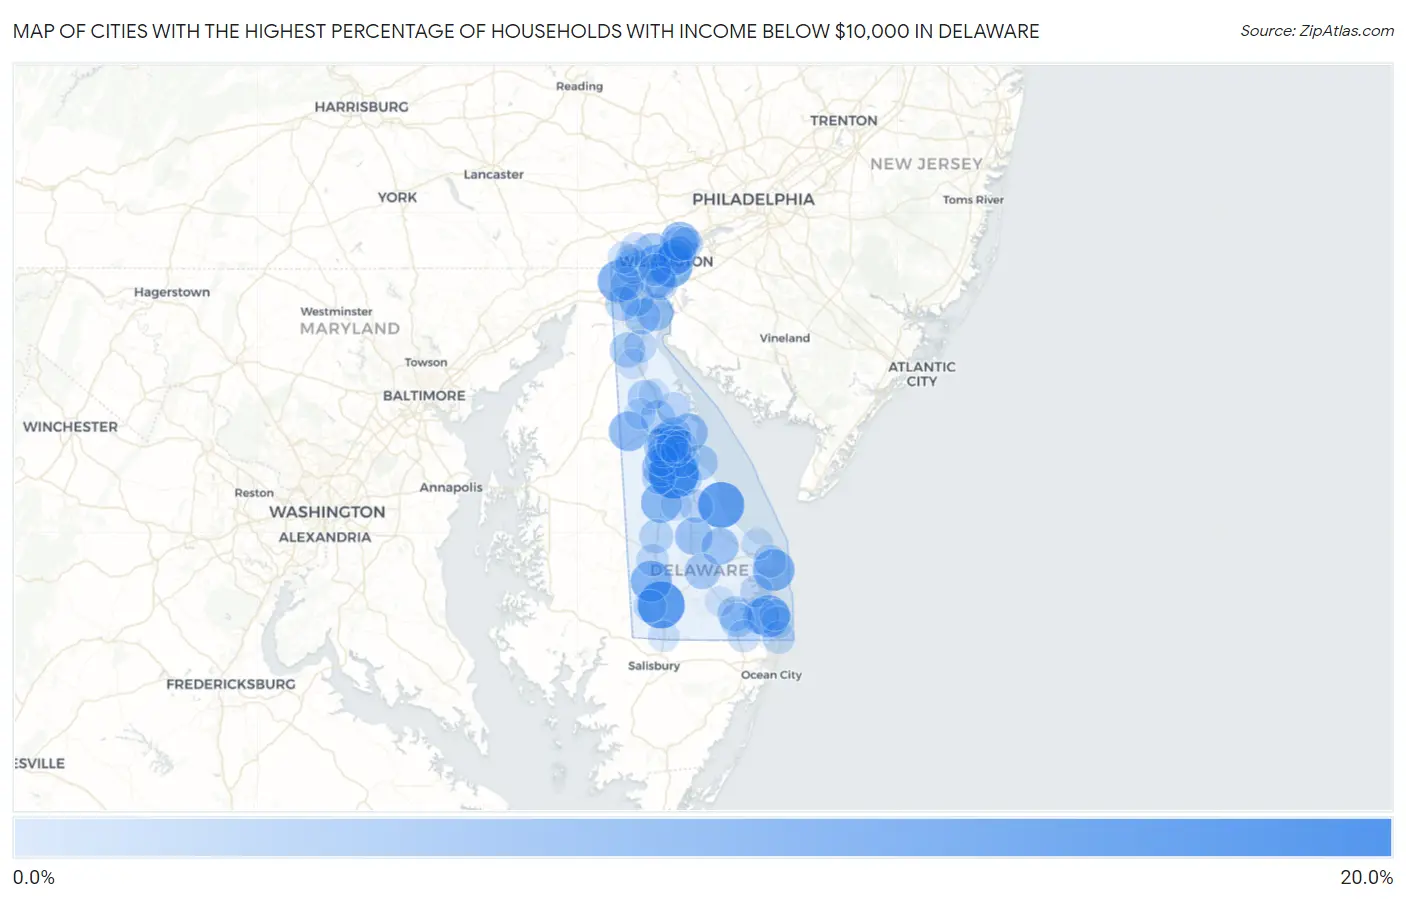
Map of Cities with the Highest Percentage of Households with Income Below $10,000 in Delaware
0.0%
20.0%
Cities with the Highest Percentage of Households with Income Below $10,000 in Delaware
| City | Households with Income < $10k | vs State | vs National | |
| 1. | Riverview | 15.9% | 4.3%(+11.6)#1 | 4.9%(+11.0)#1,880 |
| 2. | Laurel | 13.8% | 4.3%(+9.50)#2 | 4.9%(+8.90)#2,418 |
| 3. | Slaughter Beach | 13.0% | 4.3%(+8.70)#3 | 4.9%(+8.10)#2,714 |
| 4. | Wilmington | 10.1% | 4.3%(+5.80)#4 | 4.9%(+5.20)#4,302 |
| 5. | Ocean View | 9.8% | 4.3%(+5.50)#5 | 4.9%(+4.90)#4,532 |
| 6. | Newark | 9.7% | 4.3%(+5.40)#6 | 4.9%(+4.80)#4,598 |
| 7. | Dewey Beach | 9.3% | 4.3%(+5.00)#7 | 4.9%(+4.40)#4,989 |
| 8. | Seaford | 8.8% | 4.3%(+4.50)#8 | 4.9%(+3.90)#5,429 |
| 9. | Harrington | 8.5% | 4.3%(+4.20)#9 | 4.9%(+3.60)#5,783 |
| 10. | Hartly | 7.7% | 4.3%(+3.40)#10 | 4.9%(+2.80)#6,819 |
| 11. | Rodney Village | 7.4% | 4.3%(+3.10)#11 | 4.9%(+2.50)#7,224 |
| 12. | Arden | 7.2% | 4.3%(+2.90)#12 | 4.9%(+2.30)#7,552 |
| 13. | Little Creek | 6.5% | 4.3%(+2.20)#13 | 4.9%(+1.60)#8,684 |
| 14. | Viola | 6.5% | 4.3%(+2.20)#14 | 4.9%(+1.60)#8,704 |
| 15. | Elsmere | 6.1% | 4.3%(+1.80)#15 | 4.9%(+1.20)#9,283 |
| 16. | Woodside East | 6.1% | 4.3%(+1.80)#16 | 4.9%(+1.20)#9,338 |
| 17. | Ellendale | 5.9% | 4.3%(+1.60)#17 | 4.9%(+1.00)#9,808 |
| 18. | Delaware City | 5.6% | 4.3%(+1.30)#18 | 4.9%(+0.700)#10,377 |
| 19. | Bellefonte | 5.6% | 4.3%(+1.30)#19 | 4.9%(+0.700)#10,394 |
| 20. | Milton | 5.5% | 4.3%(+1.20)#20 | 4.9%(+0.600)#10,594 |
| 21. | Wyoming | 5.4% | 4.3%(+1.10)#21 | 4.9%(+0.500)#10,822 |
| 22. | Wilmington Manor | 5.1% | 4.3%(+0.800)#22 | 4.9%(+0.200)#11,451 |
| 23. | Greenville | 5.0% | 4.3%(+0.700)#23 | 4.9%(+0.100)#11,746 |
| 24. | Millville | 5.0% | 4.3%(+0.700)#24 | 4.9%(+0.100)#11,770 |
| 25. | Edgemoor | 4.8% | 4.3%(+0.500)#25 | 4.9%(-0.100)#12,186 |
| 26. | St Georges | 4.8% | 4.3%(+0.500)#26 | 4.9%(-0.100)#12,264 |
| 27. | Georgetown | 4.5% | 4.3%(+0.200)#27 | 4.9%(-0.400)#12,980 |
| 28. | Dover | 4.4% | 4.3%(+0.100)#28 | 4.9%(-0.500)#13,183 |
| 29. | Kent Acres | 4.4% | 4.3%(+0.100)#29 | 4.9%(-0.500)#13,291 |
| 30. | Bowers | 4.4% | 4.3%(+0.100)#30 | 4.9%(-0.500)#13,384 |
| 31. | Bear | 4.3% | 4.3%(=0.000)#31 | 4.9%(-0.600)#13,448 |
| 32. | Ardencroft | 4.3% | 4.3%(=0.000)#32 | 4.9%(-0.600)#13,694 |
| 33. | Middletown | 4.1% | 4.3%(-0.200)#33 | 4.9%(-0.800)#14,026 |
| 34. | Pike Creek Valley | 4.1% | 4.3%(-0.200)#34 | 4.9%(-0.800)#14,050 |
| 35. | Clayton | 4.0% | 4.3%(-0.300)#35 | 4.9%(-0.900)#14,393 |
| 36. | Dagsboro | 4.0% | 4.3%(-0.300)#36 | 4.9%(-0.900)#14,476 |
| 37. | Cheswold | 3.8% | 4.3%(-0.500)#37 | 4.9%(-1.10)#14,980 |
| 38. | Frankford | 3.7% | 4.3%(-0.600)#38 | 4.9%(-1.20)#15,330 |
| 39. | Glasgow | 3.4% | 4.3%(-0.900)#39 | 4.9%(-1.50)#16,073 |
| 40. | Greenwood | 3.3% | 4.3%(-1.000)#40 | 4.9%(-1.60)#16,517 |
| 41. | Frederica | 3.2% | 4.3%(-1.10)#41 | 4.9%(-1.70)#16,868 |
| 42. | Magnolia | 3.2% | 4.3%(-1.10)#42 | 4.9%(-1.70)#16,946 |
| 43. | Milford | 2.9% | 4.3%(-1.40)#43 | 4.9%(-2.00)#17,731 |
| 44. | Felton | 2.6% | 4.3%(-1.70)#44 | 4.9%(-2.30)#18,848 |
| 45. | New Castle | 2.5% | 4.3%(-1.80)#45 | 4.9%(-2.40)#19,069 |
| 46. | Leipsic | 2.5% | 4.3%(-1.80)#46 | 4.9%(-2.40)#19,286 |
| 47. | Brookside | 2.4% | 4.3%(-1.90)#47 | 4.9%(-2.50)#19,360 |
| 48. | Claymont | 2.4% | 4.3%(-1.90)#48 | 4.9%(-2.50)#19,376 |
| 49. | Rehoboth Beach | 2.3% | 4.3%(-2.00)#49 | 4.9%(-2.60)#19,809 |
| 50. | Bethel | 2.3% | 4.3%(-2.00)#50 | 4.9%(-2.60)#19,903 |
| 51. | Camden | 2.0% | 4.3%(-2.30)#51 | 4.9%(-2.90)#20,698 |
| 52. | Dover Base Housing | 2.0% | 4.3%(-2.30)#52 | 4.9%(-2.90)#20,711 |
| 53. | Long Neck | 2.0% | 4.3%(-2.30)#53 | 4.9%(-2.90)#20,723 |
| 54. | Odessa | 2.0% | 4.3%(-2.30)#54 | 4.9%(-2.90)#20,871 |
| 55. | Fenwick Island | 2.0% | 4.3%(-2.30)#55 | 4.9%(-2.90)#20,874 |
| 56. | Woodside | 2.0% | 4.3%(-2.30)#56 | 4.9%(-2.90)#20,886 |
| 57. | Bridgeville | 1.9% | 4.3%(-2.40)#57 | 4.9%(-3.00)#21,078 |
| 58. | Hockessin | 1.8% | 4.3%(-2.50)#58 | 4.9%(-3.10)#21,286 |
| 59. | Pike Creek | 1.8% | 4.3%(-2.50)#59 | 4.9%(-3.10)#21,327 |
| 60. | Newport | 1.8% | 4.3%(-2.50)#60 | 4.9%(-3.10)#21,428 |
| 61. | Highland Acres | 1.7% | 4.3%(-2.60)#61 | 4.9%(-3.20)#21,647 |
| 62. | Selbyville | 1.7% | 4.3%(-2.60)#62 | 4.9%(-3.20)#21,674 |
| 63. | South Bethany | 1.7% | 4.3%(-2.60)#63 | 4.9%(-3.20)#21,790 |
| 64. | North Star | 1.5% | 4.3%(-2.80)#64 | 4.9%(-3.40)#22,153 |
| 65. | Lewes | 1.5% | 4.3%(-2.80)#65 | 4.9%(-3.40)#22,208 |
| 66. | Bethany Beach | 1.1% | 4.3%(-3.20)#66 | 4.9%(-3.80)#23,346 |
| 67. | Kenton | 1.1% | 4.3%(-3.20)#67 | 4.9%(-3.80)#23,400 |
| 68. | Delmar | 1.0% | 4.3%(-3.30)#68 | 4.9%(-3.90)#23,514 |
| 69. | Houston | 1.0% | 4.3%(-3.30)#69 | 4.9%(-3.90)#23,627 |
| 70. | Rising Sun Lebanon | 0.70% | 4.3%(-3.60)#70 | 4.9%(-4.20)#24,161 |
| 71. | Townsend | 0.70% | 4.3%(-3.60)#71 | 4.9%(-4.20)#24,176 |
| 72. | Smyrna | 0.40% | 4.3%(-3.90)#72 | 4.9%(-4.50)#24,592 |
| 73. | Millsboro | 0.40% | 4.3%(-3.90)#73 | 4.9%(-4.50)#24,607 |
1
Common Questions
What are the Top 10 Cities with the Highest Percentage of Households with Income Below $10,000 in Delaware?
Top 10 Cities with the Highest Percentage of Households with Income Below $10,000 in Delaware are:
#1
15.9%
#2
13.8%
#3
13.0%
#4
10.1%
#5
9.8%
#6
9.7%
#7
9.3%
#8
8.8%
#9
8.5%
#10
7.7%
What city has the Highest Percentage of Households with Income Below $10,000 in Delaware?
Riverview has the Highest Percentage of Households with Income Below $10,000 in Delaware with 15.9%.
What is the Percentage of Households with Income Below $10,000 in the State of Delaware?
Percentage of Households with Income Below $10,000 in Delaware is 4.3%.
What is the Percentage of Households with Income Below $10,000 in the United States?
Percentage of Households with Income Below $10,000 in the United States is 4.9%.