Zip Codes with the Highest Percentage of Households with Income Below $10,000 in Washington
RELATED REPORTS & OPTIONS
Household Income | $0-10k
Washington
Compare Zip Codes
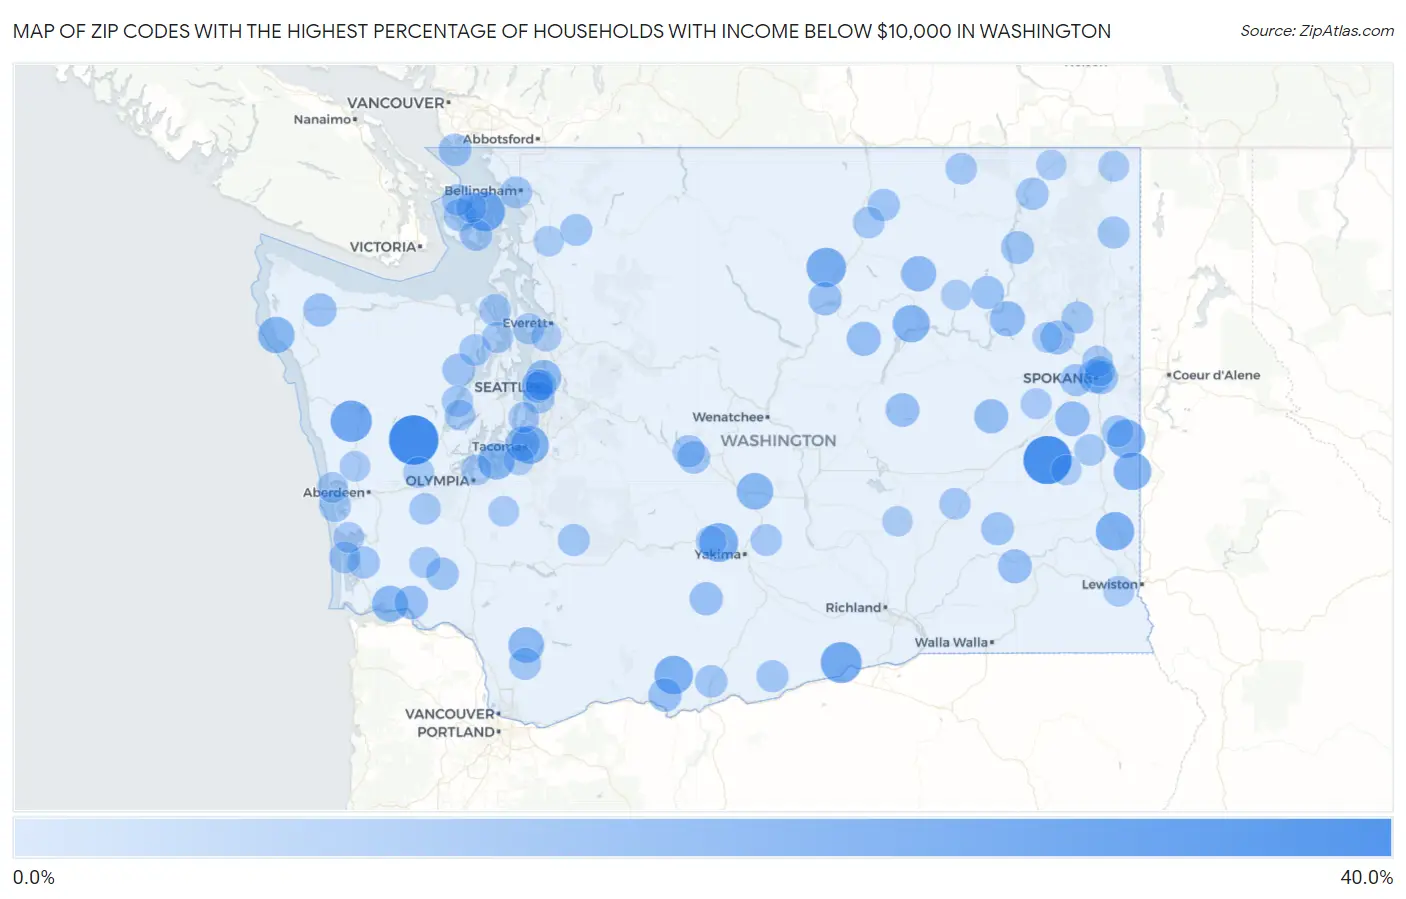
Map of Zip Codes with the Highest Percentage of Households with Income Below $10,000 in Washington
0.0%
40.0%
Zip Codes with the Highest Percentage of Households with Income Below $10,000 in Washington
| Zip Code | Households with Income < $10k | vs State | vs National | |
| 1. | 98560 | 33.3% | 3.7%(+29.6)#1 | 4.9%(+28.4)#254 |
| 2. | 99017 | 31.4% | 3.7%(+27.7)#2 | 4.9%(+26.5)#298 |
| 3. | 98566 | 21.5% | 3.7%(+17.8)#3 | 4.9%(+16.6)#676 |
| 4. | 99345 | 20.9% | 3.7%(+17.2)#4 | 4.9%(+16.0)#712 |
| 5. | 98279 | 19.6% | 3.7%(+15.9)#5 | 4.9%(+14.7)#835 |
| 6. | 98829 | 18.9% | 3.7%(+15.2)#6 | 4.9%(+14.0)#911 |
| 7. | 98923 | 17.9% | 3.7%(+14.2)#7 | 4.9%(+13.0)#1,037 |
| 8. | 98670 | 17.6% | 3.7%(+13.9)#8 | 4.9%(+12.7)#1,086 |
| 9. | 99163 | 17.4% | 3.7%(+13.7)#9 | 4.9%(+12.5)#1,097 |
| 10. | 99018 | 17.1% | 3.7%(+13.4)#10 | 4.9%(+12.2)#1,147 |
| 11. | 98421 | 16.4% | 3.7%(+12.7)#11 | 4.9%(+11.5)#1,268 |
| 12. | 99128 | 16.2% | 3.7%(+12.5)#12 | 4.9%(+11.3)#1,310 |
| 13. | 99133 | 15.6% | 3.7%(+11.9)#13 | 4.9%(+10.7)#1,416 |
| 14. | 98303 | 14.8% | 3.7%(+11.1)#14 | 4.9%(+9.90)#1,575 |
| 15. | 98934 | 14.7% | 3.7%(+11.0)#15 | 4.9%(+9.80)#1,603 |
| 16. | 98350 | 14.6% | 3.7%(+10.9)#16 | 4.9%(+9.70)#1,638 |
| 17. | 98643 | 14.0% | 3.7%(+10.3)#17 | 4.9%(+9.10)#1,786 |
| 18. | 98603 | 13.5% | 3.7%(+9.80)#18 | 4.9%(+8.60)#1,932 |
| 19. | 99155 | 13.0% | 3.7%(+9.30)#19 | 4.9%(+8.10)#2,091 |
| 20. | 98105 | 12.8% | 3.7%(+9.10)#20 | 4.9%(+7.90)#2,152 |
| 21. | 99129 | 12.8% | 3.7%(+9.10)#21 | 4.9%(+7.90)#2,177 |
| 22. | 99004 | 12.1% | 3.7%(+8.40)#22 | 4.9%(+7.20)#2,410 |
| 23. | 98402 | 11.9% | 3.7%(+8.20)#23 | 4.9%(+7.00)#2,514 |
| 24. | 99134 | 11.5% | 3.7%(+7.80)#24 | 4.9%(+6.60)#2,712 |
| 25. | 98830 | 11.4% | 3.7%(+7.70)#25 | 4.9%(+6.50)#2,772 |
| 26. | 99034 | 11.1% | 3.7%(+7.40)#26 | 4.9%(+6.20)#2,928 |
| 27. | 99359 | 11.1% | 3.7%(+7.40)#27 | 4.9%(+6.20)#2,937 |
| 28. | 99201 | 10.8% | 3.7%(+7.10)#28 | 4.9%(+5.90)#3,071 |
| 29. | 98860 | 10.8% | 3.7%(+7.10)#29 | 4.9%(+5.90)#3,107 |
| 30. | 99202 | 10.4% | 3.7%(+6.70)#30 | 4.9%(+5.50)#3,296 |
| 31. | 98635 | 10.4% | 3.7%(+6.70)#31 | 4.9%(+5.50)#3,329 |
| 32. | 98647 | 10.4% | 3.7%(+6.70)#32 | 4.9%(+5.50)#3,351 |
| 33. | 98305 | 10.4% | 3.7%(+6.70)#33 | 4.9%(+5.50)#3,352 |
| 34. | 98812 | 10.2% | 3.7%(+6.50)#34 | 4.9%(+5.30)#3,445 |
| 35. | 98952 | 10.2% | 3.7%(+6.50)#35 | 4.9%(+5.30)#3,465 |
| 36. | 99138 | 9.8% | 3.7%(+6.10)#36 | 4.9%(+4.90)#3,774 |
| 37. | 99167 | 9.7% | 3.7%(+6.00)#37 | 4.9%(+4.80)#3,850 |
| 38. | 99371 | 9.7% | 3.7%(+6.00)#38 | 4.9%(+4.80)#3,857 |
| 39. | 98320 | 9.6% | 3.7%(+5.90)#39 | 4.9%(+4.70)#3,921 |
| 40. | 98281 | 9.3% | 3.7%(+5.60)#40 | 4.9%(+4.40)#4,161 |
| 41. | 98943 | 9.3% | 3.7%(+5.60)#41 | 4.9%(+4.40)#4,175 |
| 42. | 98243 | 9.3% | 3.7%(+5.60)#42 | 4.9%(+4.40)#4,187 |
| 43. | 98538 | 9.1% | 3.7%(+5.40)#43 | 4.9%(+4.20)#4,377 |
| 44. | 98620 | 9.0% | 3.7%(+5.30)#44 | 4.9%(+4.10)#4,430 |
| 45. | 98941 | 9.0% | 3.7%(+5.30)#45 | 4.9%(+4.10)#4,469 |
| 46. | 99126 | 8.9% | 3.7%(+5.20)#46 | 4.9%(+4.00)#4,571 |
| 47. | 99001 | 8.7% | 3.7%(+5.00)#47 | 4.9%(+3.80)#4,747 |
| 48. | 98855 | 8.7% | 3.7%(+5.00)#48 | 4.9%(+3.80)#4,752 |
| 49. | 98586 | 8.7% | 3.7%(+5.00)#49 | 4.9%(+3.80)#4,777 |
| 50. | 99119 | 8.5% | 3.7%(+4.80)#50 | 4.9%(+3.60)#4,983 |
| 51. | 99356 | 8.5% | 3.7%(+4.80)#51 | 4.9%(+3.60)#5,009 |
| 52. | 98225 | 8.4% | 3.7%(+4.70)#52 | 4.9%(+3.50)#5,021 |
| 53. | 98101 | 8.4% | 3.7%(+4.70)#53 | 4.9%(+3.50)#5,043 |
| 54. | 98601 | 8.4% | 3.7%(+4.70)#54 | 4.9%(+3.50)#5,079 |
| 55. | 98355 | 8.4% | 3.7%(+4.70)#55 | 4.9%(+3.50)#5,123 |
| 56. | 98108 | 8.3% | 3.7%(+4.60)#56 | 4.9%(+3.40)#5,170 |
| 57. | 98358 | 8.3% | 3.7%(+4.60)#57 | 4.9%(+3.40)#5,261 |
| 58. | 98255 | 8.3% | 3.7%(+4.60)#58 | 4.9%(+3.40)#5,273 |
| 59. | 99110 | 8.2% | 3.7%(+4.50)#59 | 4.9%(+3.30)#5,362 |
| 60. | 98640 | 8.1% | 3.7%(+4.40)#60 | 4.9%(+3.20)#5,459 |
| 61. | 98261 | 8.1% | 3.7%(+4.40)#61 | 4.9%(+3.20)#5,478 |
| 62. | 99039 | 8.1% | 3.7%(+4.40)#62 | 4.9%(+3.20)#5,538 |
| 63. | 98901 | 8.0% | 3.7%(+4.30)#63 | 4.9%(+3.10)#5,554 |
| 64. | 98595 | 8.0% | 3.7%(+4.30)#64 | 4.9%(+3.10)#5,609 |
| 65. | 98849 | 7.9% | 3.7%(+4.20)#65 | 4.9%(+3.00)#5,762 |
| 66. | 99118 | 7.9% | 3.7%(+4.20)#66 | 4.9%(+3.00)#5,766 |
| 67. | 98376 | 7.8% | 3.7%(+4.10)#67 | 4.9%(+2.90)#5,889 |
| 68. | 98568 | 7.7% | 3.7%(+4.00)#68 | 4.9%(+2.80)#5,987 |
| 69. | 99341 | 7.7% | 3.7%(+4.00)#69 | 4.9%(+2.80)#6,020 |
| 70. | 99149 | 7.7% | 3.7%(+4.00)#70 | 4.9%(+2.80)#6,039 |
| 71. | 98555 | 7.5% | 3.7%(+3.80)#71 | 4.9%(+2.60)#6,324 |
| 72. | 98297 | 7.5% | 3.7%(+3.80)#72 | 4.9%(+2.60)#6,330 |
| 73. | 98365 | 7.4% | 3.7%(+3.70)#73 | 4.9%(+2.50)#6,398 |
| 74. | 98572 | 7.4% | 3.7%(+3.70)#74 | 4.9%(+2.50)#6,453 |
| 75. | 98236 | 7.2% | 3.7%(+3.50)#75 | 4.9%(+2.30)#6,689 |
| 76. | 98104 | 7.1% | 3.7%(+3.40)#76 | 4.9%(+2.20)#6,810 |
| 77. | 99218 | 7.0% | 3.7%(+3.30)#77 | 4.9%(+2.10)#6,979 |
| 78. | 98541 | 7.0% | 3.7%(+3.30)#78 | 4.9%(+2.10)#7,004 |
| 79. | 98569 | 7.0% | 3.7%(+3.30)#79 | 4.9%(+2.10)#7,013 |
| 80. | 98506 | 6.9% | 3.7%(+3.20)#80 | 4.9%(+2.00)#7,128 |
| 81. | 98947 | 6.9% | 3.7%(+3.20)#81 | 4.9%(+2.00)#7,213 |
| 82. | 98070 | 6.8% | 3.7%(+3.10)#82 | 4.9%(+1.90)#7,375 |
| 83. | 99008 | 6.8% | 3.7%(+3.10)#83 | 4.9%(+1.90)#7,496 |
| 84. | 99153 | 6.8% | 3.7%(+3.10)#84 | 4.9%(+1.90)#7,498 |
| 85. | 98590 | 6.8% | 3.7%(+3.10)#85 | 4.9%(+1.90)#7,501 |
| 86. | 98122 | 6.7% | 3.7%(+3.00)#86 | 4.9%(+1.80)#7,524 |
| 87. | 99403 | 6.7% | 3.7%(+3.00)#87 | 4.9%(+1.80)#7,550 |
| 88. | 98588 | 6.7% | 3.7%(+3.00)#88 | 4.9%(+1.80)#7,642 |
| 89. | 98576 | 6.6% | 3.7%(+2.90)#89 | 4.9%(+1.70)#7,788 |
| 90. | 98550 | 6.5% | 3.7%(+2.80)#90 | 4.9%(+1.60)#7,947 |
| 91. | 98245 | 6.5% | 3.7%(+2.80)#91 | 4.9%(+1.60)#7,993 |
| 92. | 98235 | 6.4% | 3.7%(+2.70)#92 | 4.9%(+1.50)#8,269 |
| 93. | 98204 | 6.3% | 3.7%(+2.60)#93 | 4.9%(+1.40)#8,304 |
| 94. | 99344 | 6.3% | 3.7%(+2.60)#94 | 4.9%(+1.40)#8,353 |
| 95. | 99140 | 6.3% | 3.7%(+2.60)#95 | 4.9%(+1.40)#8,479 |
| 96. | 99013 | 6.2% | 3.7%(+2.50)#96 | 4.9%(+1.30)#8,658 |
| 97. | 99171 | 6.2% | 3.7%(+2.50)#97 | 4.9%(+1.30)#8,682 |
| 98. | 99157 | 6.2% | 3.7%(+2.50)#98 | 4.9%(+1.30)#8,695 |
| 99. | 98499 | 6.1% | 3.7%(+2.40)#99 | 4.9%(+1.20)#8,739 |
| 100. | 99207 | 6.1% | 3.7%(+2.40)#100 | 4.9%(+1.20)#8,742 |
Common Questions
What are the Top 10 Zip Codes with the Highest Percentage of Households with Income Below $10,000 in Washington?
Top 10 Zip Codes with the Highest Percentage of Households with Income Below $10,000 in Washington are:
What zip code has the Highest Percentage of Households with Income Below $10,000 in Washington?
98560 has the Highest Percentage of Households with Income Below $10,000 in Washington with 33.3%.
What is the Percentage of Households with Income Below $10,000 in the State of Washington?
Percentage of Households with Income Below $10,000 in Washington is 3.7%.
What is the Percentage of Households with Income Below $10,000 in the United States?
Percentage of Households with Income Below $10,000 in the United States is 4.9%.