Cities with the Highest Percentage of Households with Income Below $10,000 in Maryland
RELATED REPORTS & OPTIONS
Household Income | $0-10k
Maryland
Compare Cities
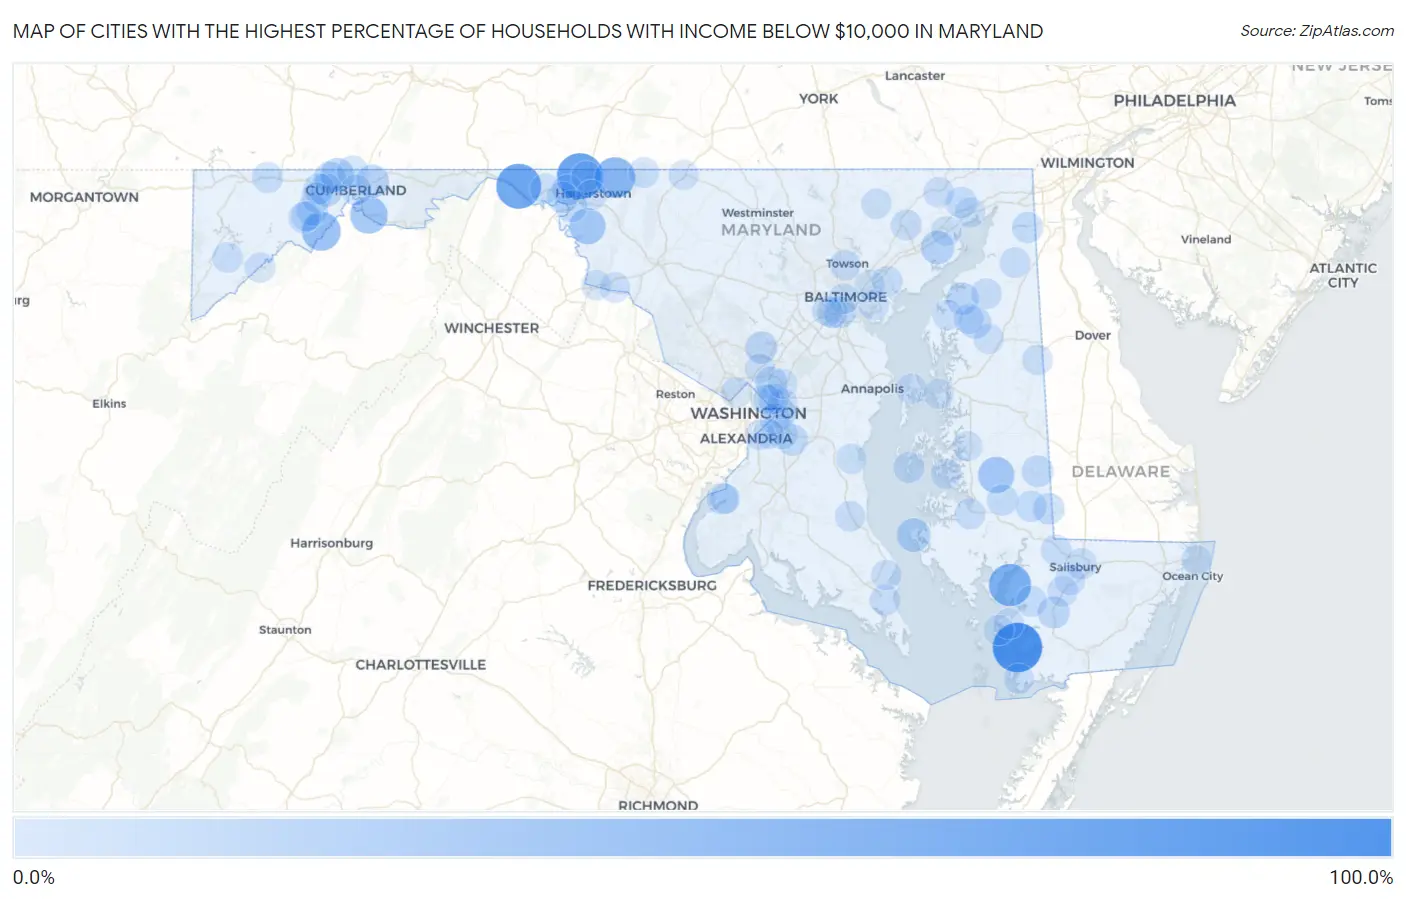
Map of Cities with the Highest Percentage of Households with Income Below $10,000 in Maryland
0.0%
100.0%
Cities with the Highest Percentage of Households with Income Below $10,000 in Maryland
| City | Households with Income < $10k | vs State | vs National | |
| 1. | Frenchtown Rumbly | 100.0% | 4.2%(+95.8)#1 | 4.9%(+95.1)#34 |
| 2. | Cearfoss | 83.2% | 4.2%(+79.0)#2 | 4.9%(+78.3)#46 |
| 3. | Pecktonville | 76.7% | 4.2%(+72.5)#3 | 4.9%(+71.8)#52 |
| 4. | Bivalve | 63.5% | 4.2%(+59.3)#4 | 4.9%(+58.6)#92 |
| 5. | Leitersburg | 55.3% | 4.2%(+51.1)#5 | 4.9%(+50.4)#131 |
| 6. | Danville | 46.7% | 4.2%(+42.5)#6 | 4.9%(+41.8)#204 |
| 7. | Spring Gap | 40.0% | 4.2%(+35.8)#7 | 4.9%(+35.1)#297 |
| 8. | Choptank | 34.5% | 4.2%(+30.3)#8 | 4.9%(+29.6)#418 |
| 9. | Tilghmanton | 33.5% | 4.2%(+29.3)#9 | 4.9%(+28.6)#439 |
| 10. | Barrelville | 22.9% | 4.2%(+18.7)#10 | 4.9%(+18.0)#951 |
| 11. | Taylors Island | 22.4% | 4.2%(+18.2)#11 | 4.9%(+17.5)#986 |
| 12. | Perryman | 21.9% | 4.2%(+17.7)#12 | 4.9%(+17.0)#1,019 |
| 13. | Pleasant Grove | 19.3% | 4.2%(+15.1)#13 | 4.9%(+14.4)#1,305 |
| 14. | Eckhart Mines | 18.0% | 4.2%(+13.8)#14 | 4.9%(+13.1)#1,489 |
| 15. | Kingstown | 16.8% | 4.2%(+12.6)#15 | 4.9%(+11.9)#1,688 |
| 16. | Butlertown | 16.2% | 4.2%(+12.0)#16 | 4.9%(+11.3)#1,825 |
| 17. | Spencerville | 15.4% | 4.2%(+11.2)#17 | 4.9%(+10.5)#1,996 |
| 18. | Princess Anne | 15.0% | 4.2%(+10.8)#18 | 4.9%(+10.1)#2,080 |
| 19. | College Park | 14.3% | 4.2%(+10.1)#19 | 4.9%(+9.40)#2,260 |
| 20. | Federalsburg | 13.4% | 4.2%(+9.20)#20 | 4.9%(+8.50)#2,541 |
| 21. | Williamsport | 13.3% | 4.2%(+9.10)#21 | 4.9%(+8.40)#2,577 |
| 22. | Mount Savage | 13.2% | 4.2%(+9.00)#22 | 4.9%(+8.30)#2,640 |
| 23. | Baltimore Highlands | 13.1% | 4.2%(+8.90)#23 | 4.9%(+8.20)#2,655 |
| 24. | Seat Pleasant | 12.5% | 4.2%(+8.30)#24 | 4.9%(+7.60)#2,898 |
| 25. | Indian Head | 12.5% | 4.2%(+8.30)#25 | 4.9%(+7.60)#2,899 |
| 26. | Melwood | 12.4% | 4.2%(+8.20)#26 | 4.9%(+7.50)#2,964 |
| 27. | Pinesburg | 12.3% | 4.2%(+8.10)#27 | 4.9%(+7.40)#3,032 |
| 28. | Gilmore | 12.0% | 4.2%(+7.80)#28 | 4.9%(+7.10)#3,182 |
| 29. | Galestown | 11.8% | 4.2%(+7.60)#29 | 4.9%(+6.90)#3,311 |
| 30. | Tilghman Island | 10.9% | 4.2%(+6.70)#30 | 4.9%(+6.00)#3,799 |
| 31. | Port Deposit | 10.9% | 4.2%(+6.70)#31 | 4.9%(+6.00)#3,805 |
| 32. | East New Market | 10.8% | 4.2%(+6.60)#32 | 4.9%(+5.90)#3,889 |
| 33. | Detmold | 10.8% | 4.2%(+6.60)#33 | 4.9%(+5.90)#3,902 |
| 34. | Grantsville | 10.7% | 4.2%(+6.50)#34 | 4.9%(+5.80)#3,936 |
| 35. | Ellerslie | 10.5% | 4.2%(+6.30)#35 | 4.9%(+5.60)#4,064 |
| 36. | Chesapeake City | 10.4% | 4.2%(+6.20)#36 | 4.9%(+5.50)#4,118 |
| 37. | Lansdowne | 10.3% | 4.2%(+6.10)#37 | 4.9%(+5.40)#4,144 |
| 38. | Frostburg | 10.0% | 4.2%(+5.80)#38 | 4.9%(+5.10)#4,374 |
| 39. | Mount Vernon | 10.0% | 4.2%(+5.80)#39 | 4.9%(+5.10)#4,396 |
| 40. | Brookview | 10.0% | 4.2%(+5.80)#40 | 4.9%(+5.10)#4,426 |
| 41. | Salisbury | 9.7% | 4.2%(+5.50)#41 | 4.9%(+4.80)#4,597 |
| 42. | Morningside | 9.6% | 4.2%(+5.40)#42 | 4.9%(+4.70)#4,710 |
| 43. | Bel Air | 9.5% | 4.2%(+5.30)#43 | 4.9%(+4.60)#4,753 |
| 44. | Cambridge | 9.4% | 4.2%(+5.20)#44 | 4.9%(+4.50)#4,843 |
| 45. | Hebron | 9.4% | 4.2%(+5.20)#45 | 4.9%(+4.50)#4,872 |
| 46. | Cumberland | 9.2% | 4.2%(+5.00)#46 | 4.9%(+4.30)#5,005 |
| 47. | Friendship Heights Village | 9.1% | 4.2%(+4.90)#47 | 4.9%(+4.20)#5,119 |
| 48. | Baltimore | 9.0% | 4.2%(+4.80)#48 | 4.9%(+4.10)#5,207 |
| 49. | Wilson Conococheague | 9.0% | 4.2%(+4.80)#49 | 4.9%(+4.10)#5,255 |
| 50. | Highfield Cascade | 9.0% | 4.2%(+4.80)#50 | 4.9%(+4.10)#5,273 |
| 51. | Cottage City | 8.7% | 4.2%(+4.50)#51 | 4.9%(+3.80)#5,597 |
| 52. | Towson | 8.6% | 4.2%(+4.40)#52 | 4.9%(+3.70)#5,648 |
| 53. | Lexington Park | 8.6% | 4.2%(+4.40)#53 | 4.9%(+3.70)#5,652 |
| 54. | Kennedyville | 8.6% | 4.2%(+4.40)#54 | 4.9%(+3.70)#5,716 |
| 55. | Cecilton | 8.4% | 4.2%(+4.20)#55 | 4.9%(+3.50)#5,942 |
| 56. | Middle River | 8.3% | 4.2%(+4.10)#56 | 4.9%(+3.40)#5,979 |
| 57. | Deer Park | 8.3% | 4.2%(+4.10)#57 | 4.9%(+3.40)#6,070 |
| 58. | Eden | 8.2% | 4.2%(+4.00)#58 | 4.9%(+3.30)#6,159 |
| 59. | Coral Hills | 8.1% | 4.2%(+3.90)#59 | 4.9%(+3.20)#6,222 |
| 60. | Prince Frederick | 8.1% | 4.2%(+3.90)#60 | 4.9%(+3.20)#6,246 |
| 61. | Darlington | 8.1% | 4.2%(+3.90)#61 | 4.9%(+3.20)#6,290 |
| 62. | Fairlee | 8.1% | 4.2%(+3.90)#62 | 4.9%(+3.20)#6,306 |
| 63. | Dames Quarter | 8.1% | 4.2%(+3.90)#63 | 4.9%(+3.20)#6,310 |
| 64. | Oxford | 8.0% | 4.2%(+3.80)#64 | 4.9%(+3.10)#6,387 |
| 65. | Landover | 7.6% | 4.2%(+3.40)#65 | 4.9%(+2.70)#6,852 |
| 66. | Brunswick | 7.6% | 4.2%(+3.40)#66 | 4.9%(+2.70)#6,872 |
| 67. | Henderson | 7.5% | 4.2%(+3.30)#67 | 4.9%(+2.60)#7,132 |
| 68. | Bladensburg | 7.4% | 4.2%(+3.20)#68 | 4.9%(+2.50)#7,175 |
| 69. | Stevensville | 7.4% | 4.2%(+3.20)#69 | 4.9%(+2.50)#7,177 |
| 70. | Glassmanor | 7.2% | 4.2%(+3.00)#70 | 4.9%(+2.30)#7,451 |
| 71. | Fruitland | 7.2% | 4.2%(+3.00)#71 | 4.9%(+2.30)#7,472 |
| 72. | Crisfield | 7.2% | 4.2%(+3.00)#72 | 4.9%(+2.30)#7,498 |
| 73. | Drum Point | 7.1% | 4.2%(+2.90)#73 | 4.9%(+2.20)#7,642 |
| 74. | Jarrettsville | 7.0% | 4.2%(+2.80)#74 | 4.9%(+2.10)#7,798 |
| 75. | Maryland Park | 7.0% | 4.2%(+2.80)#75 | 4.9%(+2.10)#7,848 |
| 76. | Friendship | 7.0% | 4.2%(+2.80)#76 | 4.9%(+2.10)#7,871 |
| 77. | Shaft | 6.9% | 4.2%(+2.70)#77 | 4.9%(+2.00)#8,024 |
| 78. | Deal Island | 6.8% | 4.2%(+2.60)#78 | 4.9%(+1.90)#8,212 |
| 79. | Kitzmiller | 6.8% | 4.2%(+2.60)#79 | 4.9%(+1.90)#8,221 |
| 80. | Chestertown | 6.7% | 4.2%(+2.50)#80 | 4.9%(+1.80)#8,274 |
| 81. | Mount Rainier | 6.6% | 4.2%(+2.40)#81 | 4.9%(+1.70)#8,412 |
| 82. | Emmitsburg | 6.6% | 4.2%(+2.40)#82 | 4.9%(+1.70)#8,431 |
| 83. | Lonaconing | 6.6% | 4.2%(+2.40)#83 | 4.9%(+1.70)#8,474 |
| 84. | Dundalk | 6.5% | 4.2%(+2.30)#84 | 4.9%(+1.60)#8,531 |
| 85. | Aberdeen | 6.5% | 4.2%(+2.30)#85 | 4.9%(+1.60)#8,551 |
| 86. | Maugansville | 6.5% | 4.2%(+2.30)#86 | 4.9%(+1.60)#8,590 |
| 87. | Church Hill | 6.5% | 4.2%(+2.30)#87 | 4.9%(+1.60)#8,632 |
| 88. | Greenbelt | 6.4% | 4.2%(+2.20)#88 | 4.9%(+1.50)#8,728 |
| 89. | Perryville | 6.4% | 4.2%(+2.20)#89 | 4.9%(+1.50)#8,763 |
| 90. | Hagerstown | 6.3% | 4.2%(+2.10)#90 | 4.9%(+1.40)#8,870 |
| 91. | Rosedale | 6.3% | 4.2%(+2.10)#91 | 4.9%(+1.40)#8,883 |
| 92. | Marlow Heights | 6.2% | 4.2%(+2.00)#92 | 4.9%(+1.30)#9,116 |
| 93. | Sandy Hook | 6.2% | 4.2%(+2.00)#93 | 4.9%(+1.30)#9,231 |
| 94. | Ocean City | 6.1% | 4.2%(+1.90)#94 | 4.9%(+1.20)#9,279 |
| 95. | Clear Spring | 6.1% | 4.2%(+1.90)#95 | 4.9%(+1.20)#9,410 |
| 96. | Grasonville | 6.0% | 4.2%(+1.80)#96 | 4.9%(+1.10)#9,532 |
| 97. | Potomac Heights | 6.0% | 4.2%(+1.80)#97 | 4.9%(+1.10)#9,580 |
| 98. | Arbutus | 5.9% | 4.2%(+1.70)#98 | 4.9%(+1.00)#9,669 |
| 99. | Easton | 5.9% | 4.2%(+1.70)#99 | 4.9%(+1.00)#9,676 |
| 100. | White Oak | 5.9% | 4.2%(+1.70)#100 | 4.9%(+1.00)#9,678 |
Common Questions
What are the Top 10 Cities with the Highest Percentage of Households with Income Below $10,000 in Maryland?
Top 10 Cities with the Highest Percentage of Households with Income Below $10,000 in Maryland are:
#1
100.0%
#2
83.2%
#3
76.7%
#4
63.5%
#5
55.3%
#6
46.7%
#7
40.0%
#8
34.5%
#9
33.5%
#10
22.9%
What city has the Highest Percentage of Households with Income Below $10,000 in Maryland?
Frenchtown Rumbly has the Highest Percentage of Households with Income Below $10,000 in Maryland with 100.0%.
What is the Percentage of Households with Income Below $10,000 in the State of Maryland?
Percentage of Households with Income Below $10,000 in Maryland is 4.2%.
What is the Percentage of Households with Income Below $10,000 in the United States?
Percentage of Households with Income Below $10,000 in the United States is 4.9%.