Cities with the Highest Percentage of Households with Income Below $10,000 in Indiana
RELATED REPORTS & OPTIONS
Household Income | $0-10k
Indiana
Compare Cities
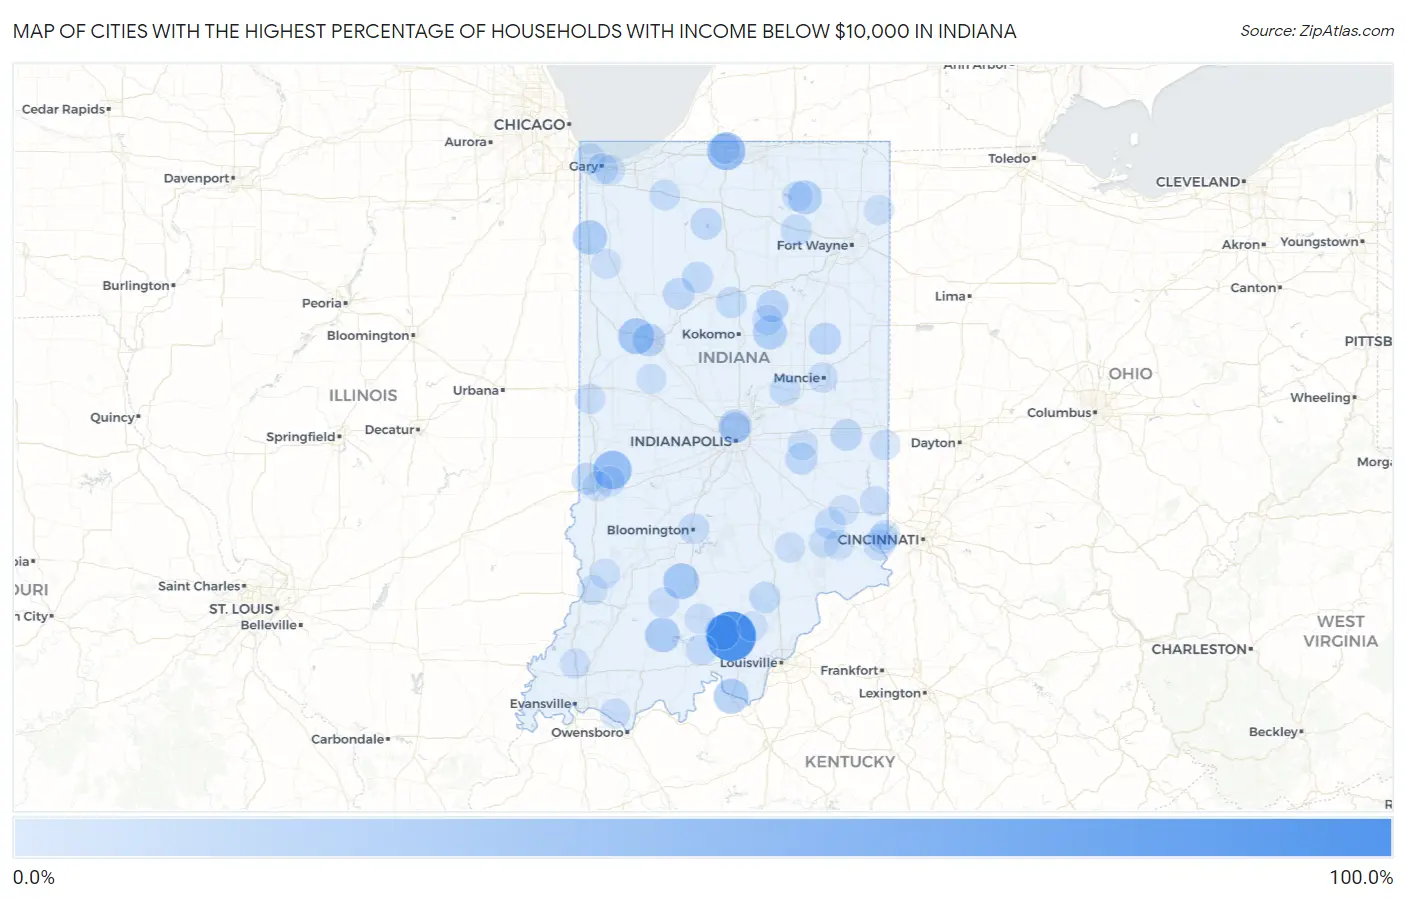
Map of Cities with the Highest Percentage of Households with Income Below $10,000 in Indiana
0.0%
100.0%
Cities with the Highest Percentage of Households with Income Below $10,000 in Indiana
| City | Households with Income < $10k | vs State | vs National | |
| 1. | Millville | 100.0% | 5.0%(+95.0)#1 | 4.9%(+95.1)#3 |
| 2. | Pence | 100.0% | 5.0%(+95.0)#2 | 4.9%(+95.1)#4 |
| 3. | Fredericksburg | 100.0% | 5.0%(+95.0)#3 | 4.9%(+95.1)#16 |
| 4. | Burney | 100.0% | 5.0%(+95.0)#4 | 4.9%(+95.1)#20 |
| 5. | Lake View | 66.7% | 5.0%(+61.7)#5 | 4.9%(+61.8)#79 |
| 6. | Groverton | 65.5% | 5.0%(+60.5)#6 | 4.9%(+60.6)#83 |
| 7. | Fontanet | 46.4% | 5.0%(+41.4)#7 | 4.9%(+41.5)#207 |
| 8. | Notre Dame | 45.5% | 5.0%(+40.5)#8 | 4.9%(+40.6)#216 |
| 9. | Forest | 44.2% | 5.0%(+39.2)#9 | 4.9%(+39.3)#237 |
| 10. | Centerton | 44.2% | 5.0%(+39.2)#10 | 4.9%(+39.3)#238 |
| 11. | Williams | 35.4% | 5.0%(+30.4)#11 | 4.9%(+30.5)#390 |
| 12. | Bear Lake | 35.3% | 5.0%(+30.3)#12 | 4.9%(+30.4)#394 |
| 13. | Montmorenci | 35.2% | 5.0%(+30.2)#13 | 4.9%(+30.3)#395 |
| 14. | Mauckport | 31.6% | 5.0%(+26.6)#14 | 4.9%(+26.7)#497 |
| 15. | Dubois | 30.3% | 5.0%(+25.3)#15 | 4.9%(+25.4)#537 |
| 16. | Hardinsburg | 30.3% | 5.0%(+25.3)#16 | 4.9%(+25.4)#540 |
| 17. | Blairsville | 30.0% | 5.0%(+25.0)#17 | 4.9%(+25.1)#549 |
| 18. | Lake Village | 28.8% | 5.0%(+23.8)#18 | 4.9%(+23.9)#604 |
| 19. | New London | 28.6% | 5.0%(+23.6)#19 | 4.9%(+23.7)#616 |
| 20. | Sims | 27.1% | 5.0%(+22.1)#20 | 4.9%(+22.2)#682 |
| 21. | Kimmell | 26.9% | 5.0%(+21.9)#21 | 4.9%(+22.0)#692 |
| 22. | Young America | 24.8% | 5.0%(+19.8)#22 | 4.9%(+19.9)#816 |
| 23. | Bippus | 24.4% | 5.0%(+19.4)#23 | 4.9%(+19.5)#839 |
| 24. | North Crows Nest | 24.1% | 5.0%(+19.1)#24 | 4.9%(+19.2)#857 |
| 25. | Amity | 23.7% | 5.0%(+18.7)#25 | 4.9%(+18.8)#887 |
| 26. | Blue Ridge | 23.3% | 5.0%(+18.3)#26 | 4.9%(+18.4)#912 |
| 27. | West Lafayette | 22.3% | 5.0%(+17.3)#27 | 4.9%(+17.4)#988 |
| 28. | Fountaintown | 22.1% | 5.0%(+17.1)#28 | 4.9%(+17.2)#1,012 |
| 29. | Petroleum | 21.6% | 5.0%(+16.6)#29 | 4.9%(+16.7)#1,051 |
| 30. | Centenary | 20.8% | 5.0%(+15.8)#30 | 4.9%(+15.9)#1,131 |
| 31. | Saugany Lake | 20.7% | 5.0%(+15.7)#31 | 4.9%(+15.8)#1,137 |
| 32. | Fairview | 20.0% | 5.0%(+15.0)#32 | 4.9%(+15.1)#1,212 |
| 33. | Hartford City | 19.1% | 5.0%(+14.1)#33 | 4.9%(+14.2)#1,325 |
| 34. | Somerset | 18.7% | 5.0%(+13.7)#34 | 4.9%(+13.8)#1,398 |
| 35. | Johnson | 18.0% | 5.0%(+13.0)#35 | 4.9%(+13.1)#1,490 |
| 36. | Wall Lake | 17.9% | 5.0%(+12.9)#36 | 4.9%(+13.0)#1,509 |
| 37. | St Mary Of The Woods | 17.5% | 5.0%(+12.5)#37 | 4.9%(+12.6)#1,564 |
| 38. | Arlington | 17.5% | 5.0%(+12.5)#38 | 4.9%(+12.6)#1,566 |
| 39. | Culver | 16.7% | 5.0%(+11.7)#39 | 4.9%(+11.8)#1,709 |
| 40. | Idaville | 16.7% | 5.0%(+11.7)#40 | 4.9%(+11.8)#1,718 |
| 41. | Adams | 16.7% | 5.0%(+11.7)#41 | 4.9%(+11.8)#1,724 |
| 42. | Mount Auburn | 16.7% | 5.0%(+11.7)#42 | 4.9%(+11.8)#1,729 |
| 43. | Flat Rock | 16.5% | 5.0%(+11.5)#43 | 4.9%(+11.6)#1,775 |
| 44. | Royal Center | 16.2% | 5.0%(+11.2)#44 | 4.9%(+11.3)#1,822 |
| 45. | Stewartsville | 16.2% | 5.0%(+11.2)#45 | 4.9%(+11.3)#1,833 |
| 46. | Little York | 15.9% | 5.0%(+10.9)#46 | 4.9%(+11.0)#1,891 |
| 47. | Lake Bruce | 15.6% | 5.0%(+10.6)#47 | 4.9%(+10.7)#1,954 |
| 48. | Webster | 15.1% | 5.0%(+10.1)#48 | 4.9%(+10.2)#2,074 |
| 49. | St. Wendel | 14.7% | 5.0%(+9.70)#49 | 4.9%(+9.80)#2,183 |
| 50. | Andersonville | 14.7% | 5.0%(+9.70)#50 | 4.9%(+9.80)#2,191 |
| 51. | Nyona Lake | 14.7% | 5.0%(+9.70)#51 | 4.9%(+9.80)#2,197 |
| 52. | Onward | 14.6% | 5.0%(+9.60)#52 | 4.9%(+9.70)#2,220 |
| 53. | Larwill | 14.4% | 5.0%(+9.40)#53 | 4.9%(+9.50)#2,254 |
| 54. | Rockfield | 14.3% | 5.0%(+9.30)#54 | 4.9%(+9.40)#2,283 |
| 55. | River Forest | 14.3% | 5.0%(+9.30)#55 | 4.9%(+9.40)#2,302 |
| 56. | English | 14.1% | 5.0%(+9.10)#56 | 4.9%(+9.20)#2,335 |
| 57. | Gilmer Park | 14.0% | 5.0%(+9.00)#57 | 4.9%(+9.10)#2,367 |
| 58. | East Chicago | 13.8% | 5.0%(+8.80)#58 | 4.9%(+8.90)#2,410 |
| 59. | Napoleon | 13.7% | 5.0%(+8.70)#59 | 4.9%(+8.80)#2,466 |
| 60. | Holiday Woods | 13.6% | 5.0%(+8.60)#60 | 4.9%(+8.70)#2,499 |
| 61. | Bloomington | 13.5% | 5.0%(+8.50)#61 | 4.9%(+8.60)#2,503 |
| 62. | Hanna | 13.5% | 5.0%(+8.50)#62 | 4.9%(+8.60)#2,527 |
| 63. | Pleasantville | 13.5% | 5.0%(+8.50)#63 | 4.9%(+8.60)#2,532 |
| 64. | Aurora | 13.2% | 5.0%(+8.20)#64 | 4.9%(+8.30)#2,627 |
| 65. | Azalia | 13.2% | 5.0%(+8.20)#65 | 4.9%(+8.30)#2,647 |
| 66. | Gary | 12.9% | 5.0%(+7.90)#66 | 4.9%(+8.00)#2,732 |
| 67. | Converse | 12.4% | 5.0%(+7.40)#67 | 4.9%(+7.50)#2,981 |
| 68. | Miami | 12.4% | 5.0%(+7.40)#68 | 4.9%(+7.50)#2,998 |
| 69. | Grayford | 12.2% | 5.0%(+7.20)#69 | 4.9%(+7.30)#3,088 |
| 70. | Crows Nest | 12.0% | 5.0%(+7.00)#70 | 4.9%(+7.10)#3,193 |
| 71. | Lawrenceburg | 11.9% | 5.0%(+6.90)#71 | 4.9%(+7.00)#3,208 |
| 72. | Shoals | 11.8% | 5.0%(+6.80)#72 | 4.9%(+6.90)#3,293 |
| 73. | Roseland | 11.7% | 5.0%(+6.70)#73 | 4.9%(+6.80)#3,338 |
| 74. | Bruceville | 11.7% | 5.0%(+6.70)#74 | 4.9%(+6.80)#3,350 |
| 75. | Boston | 11.7% | 5.0%(+6.70)#75 | 4.9%(+6.80)#3,357 |
| 76. | Cromwell | 11.6% | 5.0%(+6.60)#76 | 4.9%(+6.70)#3,404 |
| 77. | Paoli | 11.1% | 5.0%(+6.10)#77 | 4.9%(+6.20)#3,648 |
| 78. | Muncie | 11.0% | 5.0%(+6.00)#78 | 4.9%(+6.10)#3,705 |
| 79. | Seelyville | 11.0% | 5.0%(+6.00)#79 | 4.9%(+6.10)#3,734 |
| 80. | Arcola | 10.9% | 5.0%(+5.90)#80 | 4.9%(+6.00)#3,820 |
| 81. | Hatfield | 10.8% | 5.0%(+5.80)#81 | 4.9%(+5.90)#3,882 |
| 82. | Perrysville | 10.8% | 5.0%(+5.80)#82 | 4.9%(+5.90)#3,884 |
| 83. | Fort Branch | 10.7% | 5.0%(+5.70)#83 | 4.9%(+5.80)#3,919 |
| 84. | Bowling Green | 10.7% | 5.0%(+5.70)#84 | 4.9%(+5.80)#3,950 |
| 85. | Cedar Grove | 10.7% | 5.0%(+5.70)#85 | 4.9%(+5.80)#3,959 |
| 86. | Terre Haute | 10.6% | 5.0%(+5.60)#86 | 4.9%(+5.70)#3,969 |
| 87. | Country Squire Lakes | 10.6% | 5.0%(+5.60)#87 | 4.9%(+5.70)#3,988 |
| 88. | Carthage | 10.6% | 5.0%(+5.60)#88 | 4.9%(+5.70)#4,008 |
| 89. | Celestine | 10.6% | 5.0%(+5.60)#89 | 4.9%(+5.70)#4,017 |
| 90. | Lake Station | 10.5% | 5.0%(+5.50)#90 | 4.9%(+5.60)#4,030 |
| 91. | Holton | 10.5% | 5.0%(+5.50)#91 | 4.9%(+5.60)#4,061 |
| 92. | Batesville | 10.3% | 5.0%(+5.30)#92 | 4.9%(+5.40)#4,148 |
| 93. | Greendale | 10.3% | 5.0%(+5.30)#93 | 4.9%(+5.40)#4,157 |
| 94. | Freelandville | 10.3% | 5.0%(+5.30)#94 | 4.9%(+5.40)#4,186 |
| 95. | St Joe | 10.3% | 5.0%(+5.30)#95 | 4.9%(+5.40)#4,200 |
| 96. | Burnett | 10.3% | 5.0%(+5.30)#96 | 4.9%(+5.40)#4,216 |
| 97. | Mount Ayr | 10.3% | 5.0%(+5.30)#97 | 4.9%(+5.40)#4,226 |
| 98. | New Pekin | 10.2% | 5.0%(+5.20)#98 | 4.9%(+5.30)#4,273 |
| 99. | Versailles | 10.1% | 5.0%(+5.10)#99 | 4.9%(+5.20)#4,330 |
| 100. | Linden | 9.9% | 5.0%(+4.90)#100 | 4.9%(+5.00)#4,483 |
Common Questions
What are the Top 10 Cities with the Highest Percentage of Households with Income Below $10,000 in Indiana?
Top 10 Cities with the Highest Percentage of Households with Income Below $10,000 in Indiana are:
#1
100.0%
#2
46.4%
#3
45.5%
#4
35.4%
#5
35.2%
#6
31.6%
#7
30.3%
#8
30.3%
#9
28.8%
#10
27.1%
What city has the Highest Percentage of Households with Income Below $10,000 in Indiana?
Fredericksburg has the Highest Percentage of Households with Income Below $10,000 in Indiana with 100.0%.
What is the Percentage of Households with Income Below $10,000 in the State of Indiana?
Percentage of Households with Income Below $10,000 in Indiana is 5.0%.
What is the Percentage of Households with Income Below $10,000 in the United States?
Percentage of Households with Income Below $10,000 in the United States is 4.9%.