Cities with the Highest Percentage of Households with Income Below $10,000 in Connecticut
RELATED REPORTS & OPTIONS
Household Income | $0-10k
Connecticut
Compare Cities
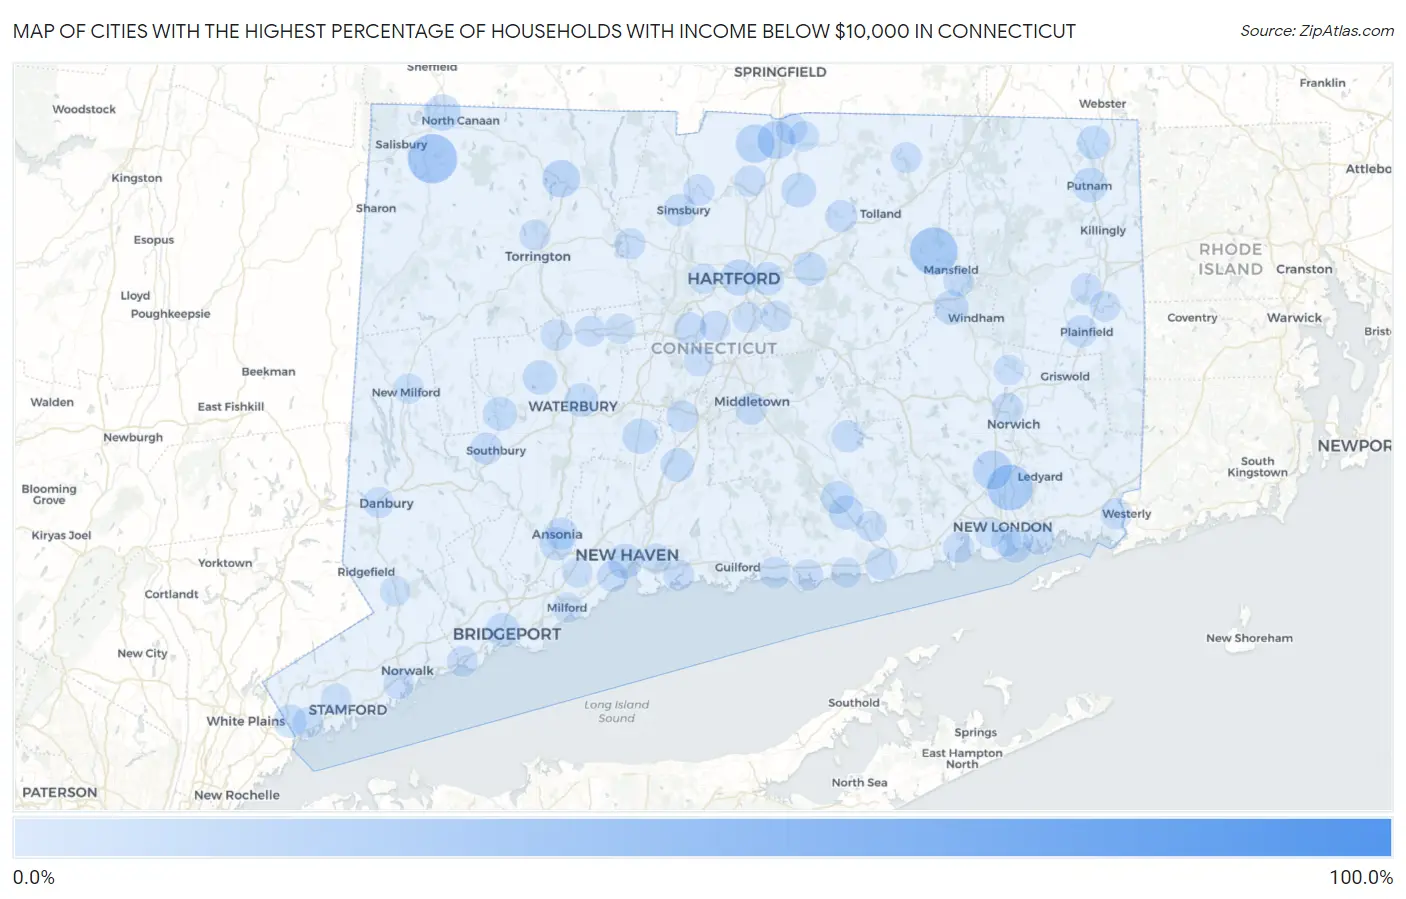
Map of Cities with the Highest Percentage of Households with Income Below $10,000 in Connecticut
0.0%
100.0%
Cities with the Highest Percentage of Households with Income Below $10,000 in Connecticut
| City | Households with Income < $10k | vs State | vs National | |
| 1. | Fairfield University | 100.0% | 4.3%(+95.7)#1 | 4.9%(+95.1)#1 |
| 2. | Falls Village | 28.9% | 4.3%(+24.6)#2 | 4.9%(+24.0)#598 |
| 3. | Storrs | 26.6% | 4.3%(+22.3)#3 | 4.9%(+21.7)#699 |
| 4. | Gales Ferry | 24.0% | 4.3%(+19.7)#4 | 4.9%(+19.1)#861 |
| 5. | Oxoboxo River | 14.9% | 4.3%(+10.6)#5 | 4.9%(+10.00)#2,117 |
| 6. | Suffield Depot | 14.1% | 4.3%(+9.80)#6 | 4.9%(+9.20)#2,329 |
| 7. | Thompsonville | 13.6% | 4.3%(+9.30)#7 | 4.9%(+8.70)#2,474 |
| 8. | Bantam Borough | 13.3% | 4.3%(+9.00)#8 | 4.9%(+8.40)#2,590 |
| 9. | Winsted | 12.9% | 4.3%(+8.60)#9 | 4.9%(+8.00)#2,737 |
| 10. | Cornwall Bridge | 12.7% | 4.3%(+8.40)#10 | 4.9%(+7.80)#2,839 |
| 11. | Indian Field | 12.6% | 4.3%(+8.30)#11 | 4.9%(+7.70)#2,868 |
| 12. | Canaan | 11.3% | 4.3%(+7.00)#12 | 4.9%(+6.40)#3,565 |
| 13. | Hartford | 11.0% | 4.3%(+6.70)#13 | 4.9%(+6.10)#3,703 |
| 14. | Stonington Borough | 9.9% | 4.3%(+5.60)#14 | 4.9%(+5.00)#4,472 |
| 15. | Cheshire Village | 9.8% | 4.3%(+5.50)#15 | 4.9%(+4.90)#4,524 |
| 16. | New Haven | 9.3% | 4.3%(+5.00)#16 | 4.9%(+4.40)#4,921 |
| 17. | Broad Brook | 9.2% | 4.3%(+4.90)#17 | 4.9%(+4.30)#5,027 |
| 18. | Putnam | 9.0% | 4.3%(+4.70)#18 | 4.9%(+4.10)#5,221 |
| 19. | Willimantic | 8.7% | 4.3%(+4.40)#19 | 4.9%(+3.80)#5,540 |
| 20. | Watertown | 8.7% | 4.3%(+4.40)#20 | 4.9%(+3.80)#5,568 |
| 21. | Deep River Center | 8.4% | 4.3%(+4.10)#21 | 4.9%(+3.50)#5,906 |
| 22. | Woodbury Center | 8.3% | 4.3%(+4.00)#22 | 4.9%(+3.40)#6,034 |
| 23. | Bridgeport | 8.1% | 4.3%(+3.80)#23 | 4.9%(+3.20)#6,203 |
| 24. | Waterbury | 7.9% | 4.3%(+3.60)#24 | 4.9%(+3.00)#6,441 |
| 25. | Wallingford Center | 7.7% | 4.3%(+3.40)#25 | 4.9%(+2.80)#6,709 |
| 26. | Derby | 7.6% | 4.3%(+3.30)#26 | 4.9%(+2.70)#6,862 |
| 27. | Manchester | 7.4% | 4.3%(+3.10)#27 | 4.9%(+2.50)#7,155 |
| 28. | North Grosvenor Dale | 7.4% | 4.3%(+3.10)#28 | 4.9%(+2.50)#7,225 |
| 29. | East Hartford | 7.1% | 4.3%(+2.80)#29 | 4.9%(+2.20)#7,596 |
| 30. | Chester Center | 7.1% | 4.3%(+2.80)#30 | 4.9%(+2.20)#7,662 |
| 31. | Glenville | 7.0% | 4.3%(+2.70)#31 | 4.9%(+2.10)#7,794 |
| 32. | Riverton | 6.6% | 4.3%(+2.30)#32 | 4.9%(+1.70)#8,515 |
| 33. | Groton | 6.5% | 4.3%(+2.20)#33 | 4.9%(+1.60)#8,559 |
| 34. | New Britain | 6.4% | 4.3%(+2.10)#34 | 4.9%(+1.50)#8,716 |
| 35. | Simsbury Center | 6.3% | 4.3%(+2.00)#35 | 4.9%(+1.40)#8,912 |
| 36. | Danielson Borough | 6.3% | 4.3%(+2.00)#36 | 4.9%(+1.40)#8,923 |
| 37. | Staples | 6.1% | 4.3%(+1.80)#37 | 4.9%(+1.20)#9,277 |
| 38. | Plattsville | 6.1% | 4.3%(+1.80)#38 | 4.9%(+1.20)#9,384 |
| 39. | Ansonia | 5.9% | 4.3%(+1.60)#39 | 4.9%(+1.00)#9,672 |
| 40. | Plainfield Village | 5.9% | 4.3%(+1.60)#40 | 4.9%(+1.00)#9,730 |
| 41. | Moodus | 5.9% | 4.3%(+1.60)#41 | 4.9%(+1.00)#9,757 |
| 42. | Rockville | 5.7% | 4.3%(+1.40)#42 | 4.9%(+0.800)#10,119 |
| 43. | Heritage Village | 5.7% | 4.3%(+1.40)#43 | 4.9%(+0.800)#10,144 |
| 44. | Groton Long Point Borough | 5.7% | 4.3%(+1.40)#44 | 4.9%(+0.800)#10,239 |
| 45. | Old Saybrook Center | 5.6% | 4.3%(+1.30)#45 | 4.9%(+0.700)#10,372 |
| 46. | Meriden | 5.5% | 4.3%(+1.20)#46 | 4.9%(+0.600)#10,512 |
| 47. | Middletown | 5.5% | 4.3%(+1.20)#47 | 4.9%(+0.600)#10,514 |
| 48. | Norwich | 5.5% | 4.3%(+1.20)#48 | 4.9%(+0.600)#10,516 |
| 49. | Thomaston | 5.0% | 4.3%(+0.700)#49 | 4.9%(+0.100)#11,768 |
| 50. | Windsor Locks | 4.9% | 4.3%(+0.600)#50 | 4.9%(=0.000)#11,928 |
| 51. | Sherwood Manor | 4.8% | 4.3%(+0.500)#51 | 4.9%(-0.100)#12,190 |
| 52. | Poquonock Bridge | 4.8% | 4.3%(+0.500)#52 | 4.9%(-0.100)#12,261 |
| 53. | Stratford Downtown | 4.7% | 4.3%(+0.400)#53 | 4.9%(-0.200)#12,522 |
| 54. | Tariffville | 4.7% | 4.3%(+0.400)#54 | 4.9%(-0.200)#12,527 |
| 55. | Pawcatuck | 4.6% | 4.3%(+0.300)#55 | 4.9%(-0.300)#12,734 |
| 56. | Madison Center | 4.6% | 4.3%(+0.300)#56 | 4.9%(-0.300)#12,803 |
| 57. | Darien Downtown | 4.6% | 4.3%(+0.300)#57 | 4.9%(-0.300)#12,819 |
| 58. | West Haven | 4.4% | 4.3%(+0.100)#58 | 4.9%(-0.500)#13,176 |
| 59. | Wauregan | 4.4% | 4.3%(+0.100)#59 | 4.9%(-0.500)#13,316 |
| 60. | Newington | 4.3% | 4.3%(=0.000)#60 | 4.9%(-0.600)#13,442 |
| 61. | Sandy Hook | 4.3% | 4.3%(=0.000)#61 | 4.9%(-0.600)#13,486 |
| 62. | Oronoque | 4.3% | 4.3%(=0.000)#62 | 4.9%(-0.600)#13,520 |
| 63. | Westport | 4.3% | 4.3%(=0.000)#63 | 4.9%(-0.600)#13,542 |
| 64. | Torrington | 4.2% | 4.3%(-0.100)#64 | 4.9%(-0.700)#13,733 |
| 65. | Trumbull Center | 4.2% | 4.3%(-0.100)#65 | 4.9%(-0.700)#13,777 |
| 66. | Branford Center | 4.2% | 4.3%(-0.100)#66 | 4.9%(-0.700)#13,790 |
| 67. | Collinsville | 4.2% | 4.3%(-0.100)#67 | 4.9%(-0.700)#13,817 |
| 68. | Clinton | 4.2% | 4.3%(-0.100)#68 | 4.9%(-0.700)#13,829 |
| 69. | Glastonbury Center | 4.1% | 4.3%(-0.200)#69 | 4.9%(-0.800)#14,061 |
| 70. | Niantic | 4.1% | 4.3%(-0.200)#70 | 4.9%(-0.800)#14,090 |
| 71. | Norwalk | 4.0% | 4.3%(-0.300)#71 | 4.9%(-0.900)#14,276 |
| 72. | Danbury | 3.9% | 4.3%(-0.400)#72 | 4.9%(-1.00)#14,591 |
| 73. | Terryville | 3.9% | 4.3%(-0.400)#73 | 4.9%(-1.00)#14,677 |
| 74. | Stafford Springs | 3.9% | 4.3%(-0.400)#74 | 4.9%(-1.00)#14,678 |
| 75. | Southport | 3.9% | 4.3%(-0.400)#75 | 4.9%(-1.00)#14,730 |
| 76. | Compo | 3.8% | 4.3%(-0.500)#76 | 4.9%(-1.10)#14,934 |
| 77. | Moosup | 3.8% | 4.3%(-0.500)#77 | 4.9%(-1.10)#14,942 |
| 78. | Essex Village | 3.8% | 4.3%(-0.500)#78 | 4.9%(-1.10)#14,951 |
| 79. | Mansfield Center | 3.8% | 4.3%(-0.500)#79 | 4.9%(-1.10)#14,995 |
| 80. | Greenwich | 3.6% | 4.3%(-0.700)#80 | 4.9%(-1.30)#15,473 |
| 81. | Noroton | 3.6% | 4.3%(-0.700)#81 | 4.9%(-1.30)#15,510 |
| 82. | Greens Farms | 3.6% | 4.3%(-0.700)#82 | 4.9%(-1.30)#15,545 |
| 83. | Bristol | 3.5% | 4.3%(-0.800)#83 | 4.9%(-1.40)#15,734 |
| 84. | Hazardville | 3.5% | 4.3%(-0.800)#84 | 4.9%(-1.40)#15,815 |
| 85. | Stamford | 3.4% | 4.3%(-0.900)#85 | 4.9%(-1.50)#16,020 |
| 86. | East Haven | 3.4% | 4.3%(-0.900)#86 | 4.9%(-1.50)#16,052 |
| 87. | New London | 3.4% | 4.3%(-0.900)#87 | 4.9%(-1.50)#16,053 |
| 88. | Jewett City Borough | 3.4% | 4.3%(-0.900)#88 | 4.9%(-1.50)#16,154 |
| 89. | Georgetown | 3.4% | 4.3%(-0.900)#89 | 4.9%(-1.50)#16,189 |
| 90. | West Hartford | 3.3% | 4.3%(-1.000)#90 | 4.9%(-1.60)#16,350 |
| 91. | Baltic | 3.3% | 4.3%(-1.000)#91 | 4.9%(-1.60)#16,548 |
| 92. | Wethersfield | 3.2% | 4.3%(-1.10)#92 | 4.9%(-1.70)#16,684 |
| 93. | New Milford | 3.2% | 4.3%(-1.10)#93 | 4.9%(-1.70)#16,746 |
| 94. | Newtown Borough | 3.2% | 4.3%(-1.10)#94 | 4.9%(-1.70)#16,814 |
| 95. | Orange | 3.1% | 4.3%(-1.20)#95 | 4.9%(-1.80)#17,048 |
| 96. | Kensington | 3.1% | 4.3%(-1.20)#96 | 4.9%(-1.80)#17,076 |
| 97. | Waterford | 3.1% | 4.3%(-1.20)#97 | 4.9%(-1.80)#17,121 |
| 98. | Candlewood Orchards | 3.1% | 4.3%(-1.20)#98 | 4.9%(-1.80)#17,254 |
| 99. | Westbrook Center | 3.0% | 4.3%(-1.30)#99 | 4.9%(-1.90)#17,480 |
| 100. | Milford City Balance | 2.9% | 4.3%(-1.40)#100 | 4.9%(-2.00)#17,672 |
Common Questions
What are the Top 10 Cities with the Highest Percentage of Households with Income Below $10,000 in Connecticut?
Top 10 Cities with the Highest Percentage of Households with Income Below $10,000 in Connecticut are:
#1
28.9%
#2
26.6%
#3
24.0%
#4
14.9%
#5
14.1%
#6
13.6%
#7
12.9%
#8
11.3%
#9
11.0%
#10
9.8%
What city has the Highest Percentage of Households with Income Below $10,000 in Connecticut?
Falls Village has the Highest Percentage of Households with Income Below $10,000 in Connecticut with 28.9%.
What is the Percentage of Households with Income Below $10,000 in the State of Connecticut?
Percentage of Households with Income Below $10,000 in Connecticut is 4.3%.
What is the Percentage of Households with Income Below $10,000 in the United States?
Percentage of Households with Income Below $10,000 in the United States is 4.9%.