Cities with the Highest Percentage of Households with Income Below $10,000 in Missouri
RELATED REPORTS & OPTIONS
Household Income | $0-10k
Missouri
Compare Cities
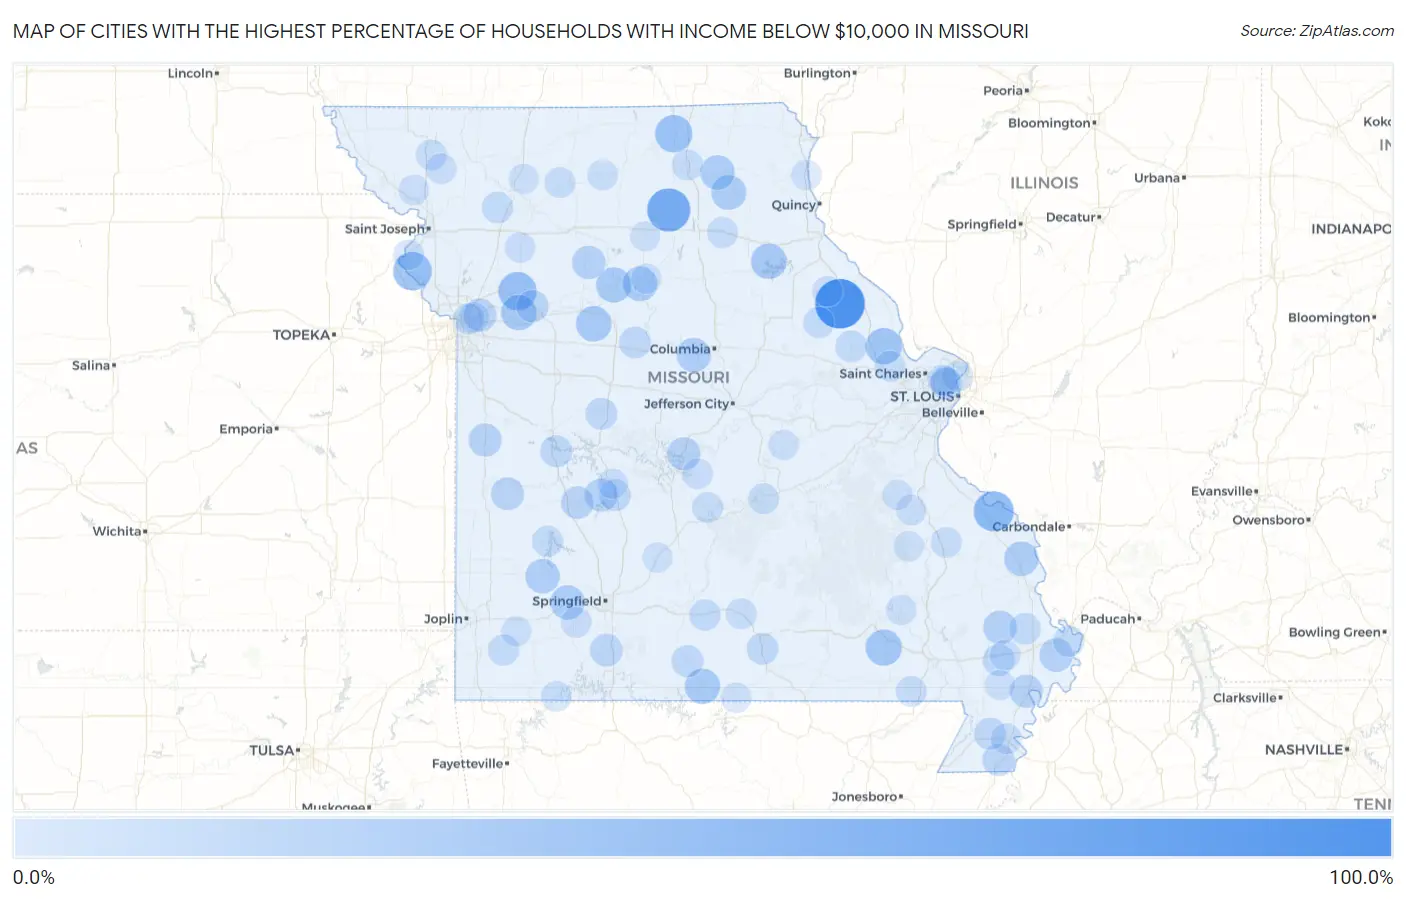
Map of Cities with the Highest Percentage of Households with Income Below $10,000 in Missouri
0.0%
100.0%
Cities with the Highest Percentage of Households with Income Below $10,000 in Missouri
| City | Households with Income < $10k | vs State | vs National | |
| 1. | Ashley | 100.0% | 5.0%(+95.0)#1 | 4.9%(+95.1)#17 |
| 2. | White Oak | 71.4% | 5.0%(+66.4)#2 | 4.9%(+66.5)#70 |
| 3. | Ethel | 70.5% | 5.0%(+65.5)#3 | 4.9%(+65.6)#72 |
| 4. | Tarsney Lakes | 57.6% | 5.0%(+52.6)#4 | 4.9%(+52.7)#117 |
| 5. | Lithium | 56.3% | 5.0%(+51.3)#5 | 4.9%(+51.4)#124 |
| 6. | Iatan | 50.0% | 5.0%(+45.0)#6 | 4.9%(+45.1)#175 |
| 7. | Rayville | 48.5% | 5.0%(+43.5)#7 | 4.9%(+43.6)#183 |
| 8. | Worthington | 44.4% | 5.0%(+39.4)#8 | 4.9%(+39.5)#230 |
| 9. | Lake Arrowhead | 42.9% | 5.0%(+37.9)#9 | 4.9%(+38.0)#256 |
| 10. | Fountain N Lakes | 40.3% | 5.0%(+35.3)#10 | 4.9%(+35.4)#290 |
| 11. | Hunter | 39.4% | 5.0%(+34.4)#11 | 4.9%(+34.5)#310 |
| 12. | Burfordville | 38.2% | 5.0%(+33.2)#12 | 4.9%(+33.3)#331 |
| 13. | Mount Leonard | 36.8% | 5.0%(+31.8)#13 | 4.9%(+31.9)#352 |
| 14. | Fleming | 36.4% | 5.0%(+31.4)#14 | 4.9%(+31.5)#364 |
| 15. | Stoutsville | 35.7% | 5.0%(+30.7)#15 | 4.9%(+30.8)#383 |
| 16. | Gainesville | 35.4% | 5.0%(+30.4)#16 | 4.9%(+30.5)#389 |
| 17. | De Witt | 34.8% | 5.0%(+29.8)#17 | 4.9%(+29.9)#408 |
| 18. | Novelty | 33.3% | 5.0%(+28.3)#18 | 4.9%(+28.4)#448 |
| 19. | Dalton | 33.3% | 5.0%(+28.3)#19 | 4.9%(+28.4)#451 |
| 20. | Pocahontas | 31.8% | 5.0%(+26.8)#20 | 4.9%(+26.9)#496 |
| 21. | Halltown | 31.6% | 5.0%(+26.6)#21 | 4.9%(+26.7)#498 |
| 22. | Hurdland | 31.4% | 5.0%(+26.4)#22 | 4.9%(+26.5)#500 |
| 23. | South Greenfield | 30.8% | 5.0%(+25.8)#23 | 4.9%(+25.9)#519 |
| 24. | Wooldridge | 30.8% | 5.0%(+25.8)#24 | 4.9%(+25.9)#522 |
| 25. | Fortuna | 28.2% | 5.0%(+23.2)#25 | 4.9%(+23.3)#632 |
| 26. | Anniston | 28.0% | 5.0%(+23.0)#26 | 4.9%(+23.1)#643 |
| 27. | Bell City | 27.7% | 5.0%(+22.7)#27 | 4.9%(+22.8)#657 |
| 28. | Tina | 27.3% | 5.0%(+22.3)#28 | 4.9%(+22.4)#672 |
| 29. | Hermitage | 26.4% | 5.0%(+21.4)#29 | 4.9%(+21.5)#716 |
| 30. | Passaic | 26.3% | 5.0%(+21.3)#30 | 4.9%(+21.4)#725 |
| 31. | Howardville | 25.6% | 5.0%(+20.6)#31 | 4.9%(+20.7)#756 |
| 32. | Bagnell | 25.6% | 5.0%(+20.6)#32 | 4.9%(+20.7)#758 |
| 33. | Harwood | 25.0% | 5.0%(+20.0)#33 | 4.9%(+20.1)#805 |
| 34. | River Bend | 25.0% | 5.0%(+20.0)#34 | 4.9%(+20.1)#808 |
| 35. | Weaubleau | 24.4% | 5.0%(+19.4)#35 | 4.9%(+19.5)#835 |
| 36. | Spokane | 23.5% | 5.0%(+18.5)#36 | 4.9%(+18.6)#894 |
| 37. | Steele | 22.4% | 5.0%(+17.4)#37 | 4.9%(+17.5)#980 |
| 38. | Normandy | 22.2% | 5.0%(+17.2)#38 | 4.9%(+17.3)#994 |
| 39. | Henrietta | 21.9% | 5.0%(+16.9)#39 | 4.9%(+17.0)#1,021 |
| 40. | Wasola | 21.2% | 5.0%(+16.2)#40 | 4.9%(+16.3)#1,097 |
| 41. | Preston | 21.1% | 5.0%(+16.1)#41 | 4.9%(+16.2)#1,102 |
| 42. | Bragg City | 21.1% | 5.0%(+16.1)#42 | 4.9%(+16.2)#1,104 |
| 43. | Brownington | 21.1% | 5.0%(+16.1)#43 | 4.9%(+16.2)#1,105 |
| 44. | Penermon | 20.8% | 5.0%(+15.8)#44 | 4.9%(+15.9)#1,130 |
| 45. | Ionia | 20.7% | 5.0%(+15.7)#45 | 4.9%(+15.8)#1,139 |
| 46. | Pomona | 20.0% | 5.0%(+15.0)#46 | 4.9%(+15.1)#1,202 |
| 47. | Nelson | 20.0% | 5.0%(+15.0)#47 | 4.9%(+15.1)#1,210 |
| 48. | Hawk Point | 19.7% | 5.0%(+14.7)#48 | 4.9%(+14.8)#1,257 |
| 49. | Haywood City | 19.7% | 5.0%(+14.7)#49 | 4.9%(+14.8)#1,260 |
| 50. | Weatherby | 19.2% | 5.0%(+14.2)#50 | 4.9%(+14.3)#1,322 |
| 51. | Norwood | 18.9% | 5.0%(+13.9)#51 | 4.9%(+14.0)#1,360 |
| 52. | Lake Timberline | 18.3% | 5.0%(+13.3)#52 | 4.9%(+13.4)#1,442 |
| 53. | Wilson City | 17.9% | 5.0%(+12.9)#53 | 4.9%(+13.0)#1,514 |
| 54. | Stark City | 17.8% | 5.0%(+12.8)#54 | 4.9%(+12.9)#1,528 |
| 55. | Umber View Heights | 17.4% | 5.0%(+12.4)#55 | 4.9%(+12.5)#1,583 |
| 56. | Middletown | 17.0% | 5.0%(+12.0)#56 | 4.9%(+12.1)#1,654 |
| 57. | Hayti Heights | 16.9% | 5.0%(+11.9)#57 | 4.9%(+12.0)#1,675 |
| 58. | Kirksville | 16.8% | 5.0%(+11.8)#58 | 4.9%(+11.9)#1,684 |
| 59. | Randolph | 16.7% | 5.0%(+11.7)#59 | 4.9%(+11.8)#1,747 |
| 60. | Josephville | 16.5% | 5.0%(+11.5)#60 | 4.9%(+11.6)#1,770 |
| 61. | Clarence | 16.4% | 5.0%(+11.4)#61 | 4.9%(+11.5)#1,790 |
| 62. | Faucett | 16.4% | 5.0%(+11.4)#62 | 4.9%(+11.5)#1,795 |
| 63. | Edinburg | 16.2% | 5.0%(+11.2)#63 | 4.9%(+11.3)#1,835 |
| 64. | Cabool | 16.1% | 5.0%(+11.1)#64 | 4.9%(+11.2)#1,839 |
| 65. | Arkoe | 16.1% | 5.0%(+11.1)#65 | 4.9%(+11.2)#1,855 |
| 66. | Naylor | 16.0% | 5.0%(+11.0)#66 | 4.9%(+11.1)#1,865 |
| 67. | Richland | 15.8% | 5.0%(+10.8)#67 | 4.9%(+10.9)#1,900 |
| 68. | Philadelphia | 15.8% | 5.0%(+10.8)#68 | 4.9%(+10.9)#1,910 |
| 69. | Newburg | 15.6% | 5.0%(+10.6)#69 | 4.9%(+10.7)#1,952 |
| 70. | Glasgow Village | 15.5% | 5.0%(+10.5)#70 | 4.9%(+10.6)#1,971 |
| 71. | Mine La Motte | 15.5% | 5.0%(+10.5)#71 | 4.9%(+10.6)#1,985 |
| 72. | Brumley | 15.4% | 5.0%(+10.4)#72 | 4.9%(+10.5)#2,014 |
| 73. | Medill | 15.3% | 5.0%(+10.3)#73 | 4.9%(+10.4)#2,036 |
| 74. | Birmingham | 15.3% | 5.0%(+10.3)#74 | 4.9%(+10.4)#2,039 |
| 75. | Billings | 15.0% | 5.0%(+10.00)#75 | 4.9%(+10.1)#2,092 |
| 76. | Guilford | 15.0% | 5.0%(+10.00)#76 | 4.9%(+10.1)#2,106 |
| 77. | Curryville | 14.9% | 5.0%(+9.90)#77 | 4.9%(+10.00)#2,130 |
| 78. | Cross Timbers | 14.7% | 5.0%(+9.70)#78 | 4.9%(+9.80)#2,189 |
| 79. | Rushville | 14.7% | 5.0%(+9.70)#79 | 4.9%(+9.80)#2,193 |
| 80. | Fillmore | 14.7% | 5.0%(+9.70)#80 | 4.9%(+9.80)#2,195 |
| 81. | Wortham | 14.5% | 5.0%(+9.50)#81 | 4.9%(+9.60)#2,243 |
| 82. | Kingston | 14.3% | 5.0%(+9.30)#82 | 4.9%(+9.40)#2,278 |
| 83. | Humphreys | 14.3% | 5.0%(+9.30)#83 | 4.9%(+9.40)#2,290 |
| 84. | Grayridge | 14.3% | 5.0%(+9.30)#84 | 4.9%(+9.40)#2,293 |
| 85. | Kinloch | 14.2% | 5.0%(+9.20)#85 | 4.9%(+9.30)#2,318 |
| 86. | Chain O Lakes | 14.1% | 5.0%(+9.10)#86 | 4.9%(+9.20)#2,344 |
| 87. | Piedmont | 14.0% | 5.0%(+9.00)#87 | 4.9%(+9.10)#2,353 |
| 88. | Arcadia | 13.9% | 5.0%(+8.90)#88 | 4.9%(+9.00)#2,398 |
| 89. | Mineral Point | 13.9% | 5.0%(+8.90)#89 | 4.9%(+9.00)#2,401 |
| 90. | Wentworth | 13.9% | 5.0%(+8.90)#90 | 4.9%(+9.00)#2,408 |
| 91. | Coffey | 13.7% | 5.0%(+8.70)#91 | 4.9%(+8.80)#2,468 |
| 92. | Conway | 13.6% | 5.0%(+8.60)#92 | 4.9%(+8.70)#2,487 |
| 93. | Middle Grove | 13.6% | 5.0%(+8.60)#93 | 4.9%(+8.70)#2,501 |
| 94. | Canton | 13.5% | 5.0%(+8.50)#94 | 4.9%(+8.60)#2,514 |
| 95. | Parma | 13.5% | 5.0%(+8.50)#95 | 4.9%(+8.60)#2,526 |
| 96. | Keytesville | 13.5% | 5.0%(+8.50)#96 | 4.9%(+8.60)#2,530 |
| 97. | Belle | 13.4% | 5.0%(+8.40)#97 | 4.9%(+8.50)#2,543 |
| 98. | Cool Valley | 13.4% | 5.0%(+8.40)#98 | 4.9%(+8.50)#2,545 |
| 99. | Marceline | 13.3% | 5.0%(+8.30)#99 | 4.9%(+8.40)#2,574 |
| 100. | Bakersfield | 13.3% | 5.0%(+8.30)#100 | 4.9%(+8.40)#2,604 |
Common Questions
What are the Top 10 Cities with the Highest Percentage of Households with Income Below $10,000 in Missouri?
Top 10 Cities with the Highest Percentage of Households with Income Below $10,000 in Missouri are:
#1
100.0%
#2
70.5%
#3
56.3%
#4
50.0%
#5
48.5%
#6
44.4%
#7
40.3%
#8
39.4%
#9
36.8%
#10
36.4%
What city has the Highest Percentage of Households with Income Below $10,000 in Missouri?
Ashley has the Highest Percentage of Households with Income Below $10,000 in Missouri with 100.0%.
What is the Percentage of Households with Income Below $10,000 in the State of Missouri?
Percentage of Households with Income Below $10,000 in Missouri is 5.0%.
What is the Percentage of Households with Income Below $10,000 in the United States?
Percentage of Households with Income Below $10,000 in the United States is 4.9%.