Cities with the Highest Percentage of Households with Income Below $10,000 in Louisiana
RELATED REPORTS & OPTIONS
Household Income | $0-10k
Louisiana
Compare Cities
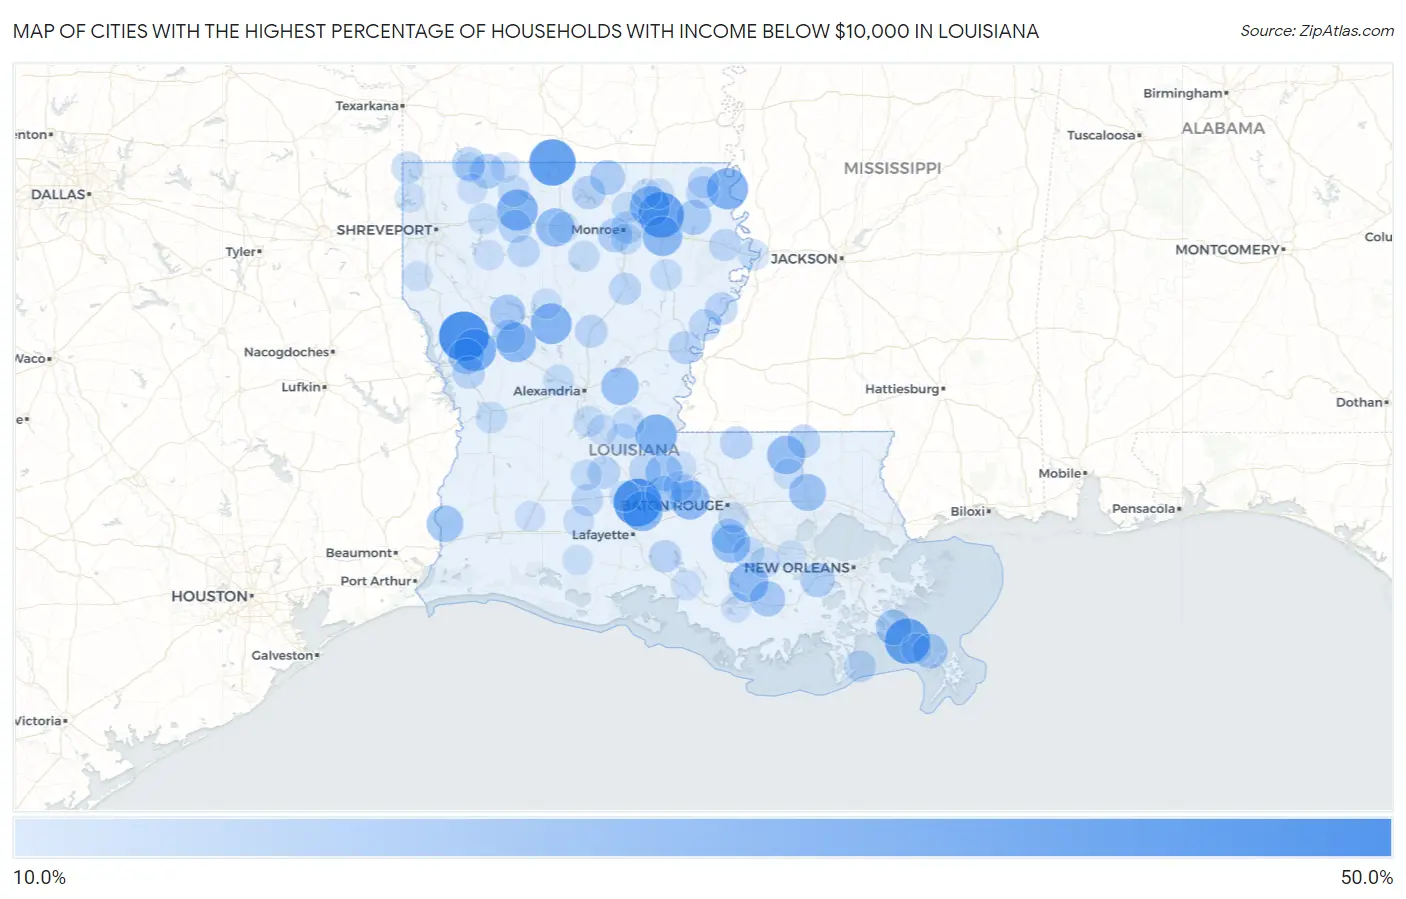
Map of Cities with the Highest Percentage of Households with Income Below $10,000 in Louisiana
0.0%
50.0%
Cities with the Highest Percentage of Households with Income Below $10,000 in Louisiana
| City | Households with Income < $10k | vs State | vs National | |
| 1. | Belmont | 42.9% | 7.4%(+35.5)#1 | 4.9%(+38.0)#255 |
| 2. | Morrow | 41.2% | 7.4%(+33.8)#2 | 4.9%(+36.3)#277 |
| 3. | Centerville | 40.0% | 7.4%(+32.6)#3 | 4.9%(+35.1)#293 |
| 4. | Leonville | 39.8% | 7.4%(+32.4)#4 | 4.9%(+34.9)#303 |
| 5. | Junction City | 37.7% | 7.4%(+30.3)#5 | 4.9%(+32.8)#336 |
| 6. | Oak Ridge | 36.4% | 7.4%(+29.0)#6 | 4.9%(+31.5)#363 |
| 7. | Empire | 36.1% | 7.4%(+28.7)#7 | 4.9%(+31.2)#372 |
| 8. | Fort Jesup | 31.1% | 7.4%(+23.7)#8 | 4.9%(+26.2)#508 |
| 9. | Simmesport | 29.8% | 7.4%(+22.4)#9 | 4.9%(+24.9)#562 |
| 10. | Lake Providence | 29.7% | 7.4%(+22.3)#10 | 4.9%(+24.8)#566 |
| 11. | Athens | 29.1% | 7.4%(+21.7)#11 | 4.9%(+24.2)#593 |
| 12. | Atlanta | 28.9% | 7.4%(+21.5)#12 | 4.9%(+24.0)#600 |
| 13. | Collinston | 28.0% | 7.4%(+20.6)#13 | 4.9%(+23.1)#644 |
| 14. | Arnaudville | 27.8% | 7.4%(+20.4)#14 | 4.9%(+22.9)#651 |
| 15. | Rayville | 27.3% | 7.4%(+19.9)#15 | 4.9%(+22.4)#670 |
| 16. | Supreme | 26.6% | 7.4%(+19.2)#16 | 4.9%(+21.7)#704 |
| 17. | Natchez | 26.6% | 7.4%(+19.2)#17 | 4.9%(+21.7)#705 |
| 18. | Maringouin | 26.5% | 7.4%(+19.1)#18 | 4.9%(+21.6)#708 |
| 19. | Grambling | 25.2% | 7.4%(+17.8)#19 | 4.9%(+20.3)#775 |
| 20. | Greensburg | 25.1% | 7.4%(+17.7)#20 | 4.9%(+20.2)#779 |
| 21. | White Castle | 25.0% | 7.4%(+17.6)#21 | 4.9%(+20.1)#781 |
| 22. | Deville | 23.8% | 7.4%(+16.4)#22 | 4.9%(+18.9)#874 |
| 23. | Natalbany | 23.1% | 7.4%(+15.7)#23 | 4.9%(+18.2)#920 |
| 24. | Melville | 22.8% | 7.4%(+15.4)#24 | 4.9%(+17.9)#954 |
| 25. | Starks | 22.5% | 7.4%(+15.1)#25 | 4.9%(+17.6)#973 |
| 26. | Krotz Springs | 21.8% | 7.4%(+14.4)#26 | 4.9%(+16.9)#1,025 |
| 27. | Many | 21.1% | 7.4%(+13.7)#27 | 4.9%(+16.2)#1,099 |
| 28. | Port Sulphur | 21.1% | 7.4%(+13.7)#28 | 4.9%(+16.2)#1,100 |
| 29. | Schriever | 20.8% | 7.4%(+13.4)#29 | 4.9%(+15.9)#1,119 |
| 30. | Campti | 20.8% | 7.4%(+13.4)#30 | 4.9%(+15.9)#1,123 |
| 31. | Epps | 20.2% | 7.4%(+12.8)#31 | 4.9%(+15.3)#1,174 |
| 32. | Boothville | 20.0% | 7.4%(+12.6)#32 | 4.9%(+15.1)#1,194 |
| 33. | Bayou Goula | 20.0% | 7.4%(+12.6)#33 | 4.9%(+15.1)#1,200 |
| 34. | Marion | 19.9% | 7.4%(+12.5)#34 | 4.9%(+15.0)#1,234 |
| 35. | Shongaloo | 19.6% | 7.4%(+12.2)#35 | 4.9%(+14.7)#1,272 |
| 36. | Boutte | 19.4% | 7.4%(+12.0)#36 | 4.9%(+14.5)#1,284 |
| 37. | Bawcomville | 18.9% | 7.4%(+11.5)#37 | 4.9%(+14.0)#1,357 |
| 38. | Natchitoches | 18.0% | 7.4%(+10.6)#38 | 4.9%(+13.1)#1,482 |
| 39. | Farmerville | 17.9% | 7.4%(+10.5)#39 | 4.9%(+13.0)#1,497 |
| 40. | Springhill | 17.8% | 7.4%(+10.4)#40 | 4.9%(+12.9)#1,517 |
| 41. | Kentwood | 17.3% | 7.4%(+9.90)#41 | 4.9%(+12.4)#1,589 |
| 42. | Gibsland | 17.1% | 7.4%(+9.70)#42 | 4.9%(+12.2)#1,624 |
| 43. | Ferriday | 17.0% | 7.4%(+9.60)#43 | 4.9%(+12.1)#1,638 |
| 44. | St Joseph | 16.9% | 7.4%(+9.50)#44 | 4.9%(+12.0)#1,671 |
| 45. | Forest | 16.7% | 7.4%(+9.30)#45 | 4.9%(+11.8)#1,719 |
| 46. | Georgetown | 16.7% | 7.4%(+9.30)#46 | 4.9%(+11.8)#1,721 |
| 47. | Ville Platte | 16.6% | 7.4%(+9.20)#47 | 4.9%(+11.7)#1,753 |
| 48. | Florien | 16.6% | 7.4%(+9.20)#48 | 4.9%(+11.7)#1,758 |
| 49. | Loreauville | 16.5% | 7.4%(+9.10)#49 | 4.9%(+11.6)#1,767 |
| 50. | Wilson | 16.5% | 7.4%(+9.10)#50 | 4.9%(+11.6)#1,771 |
| 51. | Monroe | 16.0% | 7.4%(+8.60)#51 | 4.9%(+11.1)#1,858 |
| 52. | Palmetto | 15.9% | 7.4%(+8.50)#52 | 4.9%(+11.0)#1,892 |
| 53. | Marthaville | 15.8% | 7.4%(+8.40)#53 | 4.9%(+10.9)#1,917 |
| 54. | Tallulah | 15.7% | 7.4%(+8.30)#54 | 4.9%(+10.8)#1,920 |
| 55. | Banks Springs | 15.7% | 7.4%(+8.30)#55 | 4.9%(+10.8)#1,924 |
| 56. | Waterproof | 15.7% | 7.4%(+8.30)#56 | 4.9%(+10.8)#1,932 |
| 57. | Bienville | 15.6% | 7.4%(+8.20)#57 | 4.9%(+10.7)#1,956 |
| 58. | Rodessa | 15.6% | 7.4%(+8.20)#58 | 4.9%(+10.7)#1,957 |
| 59. | Eunice | 15.5% | 7.4%(+8.10)#59 | 4.9%(+10.6)#1,969 |
| 60. | Grand Isle | 15.5% | 7.4%(+8.10)#60 | 4.9%(+10.6)#1,979 |
| 61. | Homer | 15.0% | 7.4%(+7.60)#61 | 4.9%(+10.1)#2,084 |
| 62. | Leesville | 14.9% | 7.4%(+7.50)#62 | 4.9%(+10.00)#2,111 |
| 63. | Winnsboro | 14.9% | 7.4%(+7.50)#63 | 4.9%(+10.00)#2,112 |
| 64. | Mansura | 14.9% | 7.4%(+7.50)#64 | 4.9%(+10.00)#2,120 |
| 65. | Oak Grove | 14.8% | 7.4%(+7.40)#65 | 4.9%(+9.90)#2,150 |
| 66. | Chatham | 14.7% | 7.4%(+7.30)#66 | 4.9%(+9.80)#2,184 |
| 67. | Donaldsonville | 14.6% | 7.4%(+7.20)#67 | 4.9%(+9.70)#2,202 |
| 68. | Opelousas | 14.5% | 7.4%(+7.10)#68 | 4.9%(+9.60)#2,224 |
| 69. | Lecompte | 14.4% | 7.4%(+7.00)#69 | 4.9%(+9.50)#2,252 |
| 70. | Dixie Inn | 14.4% | 7.4%(+7.00)#70 | 4.9%(+9.50)#2,258 |
| 71. | Richwood | 14.3% | 7.4%(+6.90)#71 | 4.9%(+9.40)#2,262 |
| 72. | Sterlington | 14.3% | 7.4%(+6.90)#72 | 4.9%(+9.40)#2,265 |
| 73. | Delta | 14.3% | 7.4%(+6.90)#73 | 4.9%(+9.40)#2,282 |
| 74. | Livonia | 14.1% | 7.4%(+6.70)#74 | 4.9%(+9.20)#2,334 |
| 75. | Boyce | 14.0% | 7.4%(+6.60)#75 | 4.9%(+9.10)#2,360 |
| 76. | Reddell | 14.0% | 7.4%(+6.60)#76 | 4.9%(+9.10)#2,370 |
| 77. | Evergreen | 14.0% | 7.4%(+6.60)#77 | 4.9%(+9.10)#2,375 |
| 78. | Cheneyville | 13.9% | 7.4%(+6.50)#78 | 4.9%(+9.00)#2,395 |
| 79. | St James | 13.9% | 7.4%(+6.50)#79 | 4.9%(+9.00)#2,397 |
| 80. | Ruston | 13.8% | 7.4%(+6.40)#80 | 4.9%(+8.90)#2,411 |
| 81. | Iota | 13.6% | 7.4%(+6.20)#81 | 4.9%(+8.70)#2,480 |
| 82. | Montpelier | 13.6% | 7.4%(+6.20)#82 | 4.9%(+8.70)#2,490 |
| 83. | Calvin | 13.6% | 7.4%(+6.20)#83 | 4.9%(+8.70)#2,495 |
| 84. | Gardere | 13.5% | 7.4%(+6.10)#84 | 4.9%(+8.60)#2,506 |
| 85. | Mer Rouge | 13.5% | 7.4%(+6.10)#85 | 4.9%(+8.60)#2,521 |
| 86. | Fordoche | 13.4% | 7.4%(+6.00)#86 | 4.9%(+8.50)#2,546 |
| 87. | Baldwin | 13.3% | 7.4%(+5.90)#87 | 4.9%(+8.40)#2,576 |
| 88. | Gueydan | 13.3% | 7.4%(+5.90)#88 | 4.9%(+8.40)#2,581 |
| 89. | Buras | 13.3% | 7.4%(+5.90)#89 | 4.9%(+8.40)#2,587 |
| 90. | Fenton | 13.3% | 7.4%(+5.90)#90 | 4.9%(+8.40)#2,605 |
| 91. | Ringgold | 13.2% | 7.4%(+5.80)#91 | 4.9%(+8.30)#2,632 |
| 92. | Cotton Valley | 13.2% | 7.4%(+5.80)#92 | 4.9%(+8.30)#2,636 |
| 93. | Bastrop | 13.0% | 7.4%(+5.60)#93 | 4.9%(+8.10)#2,691 |
| 94. | Oil City | 12.9% | 7.4%(+5.50)#94 | 4.9%(+8.00)#2,756 |
| 95. | Cullen | 12.9% | 7.4%(+5.50)#95 | 4.9%(+8.00)#2,761 |
| 96. | Keachi | 12.9% | 7.4%(+5.50)#96 | 4.9%(+8.00)#2,770 |
| 97. | Haynesville | 12.8% | 7.4%(+5.40)#97 | 4.9%(+7.90)#2,786 |
| 98. | Amelia | 12.8% | 7.4%(+5.40)#98 | 4.9%(+7.90)#2,788 |
| 99. | Garyville | 12.7% | 7.4%(+5.30)#99 | 4.9%(+7.80)#2,822 |
| 100. | Morganza | 12.7% | 7.4%(+5.30)#100 | 4.9%(+7.80)#2,832 |
Common Questions
What are the Top 10 Cities with the Highest Percentage of Households with Income Below $10,000 in Louisiana?
Top 10 Cities with the Highest Percentage of Households with Income Below $10,000 in Louisiana are:
#1
42.9%
#2
39.8%
#3
37.7%
#4
36.4%
#5
36.1%
#6
31.1%
#7
29.8%
#8
29.7%
#9
29.1%
#10
28.9%
What city has the Highest Percentage of Households with Income Below $10,000 in Louisiana?
Belmont has the Highest Percentage of Households with Income Below $10,000 in Louisiana with 42.9%.
What is the Percentage of Households with Income Below $10,000 in the State of Louisiana?
Percentage of Households with Income Below $10,000 in Louisiana is 7.4%.
What is the Percentage of Households with Income Below $10,000 in the United States?
Percentage of Households with Income Below $10,000 in the United States is 4.9%.