Cities with the Highest Percentage of Households with Income Below $10,000 in Nebraska
RELATED REPORTS & OPTIONS
Household Income | $0-10k
Nebraska
Compare Cities
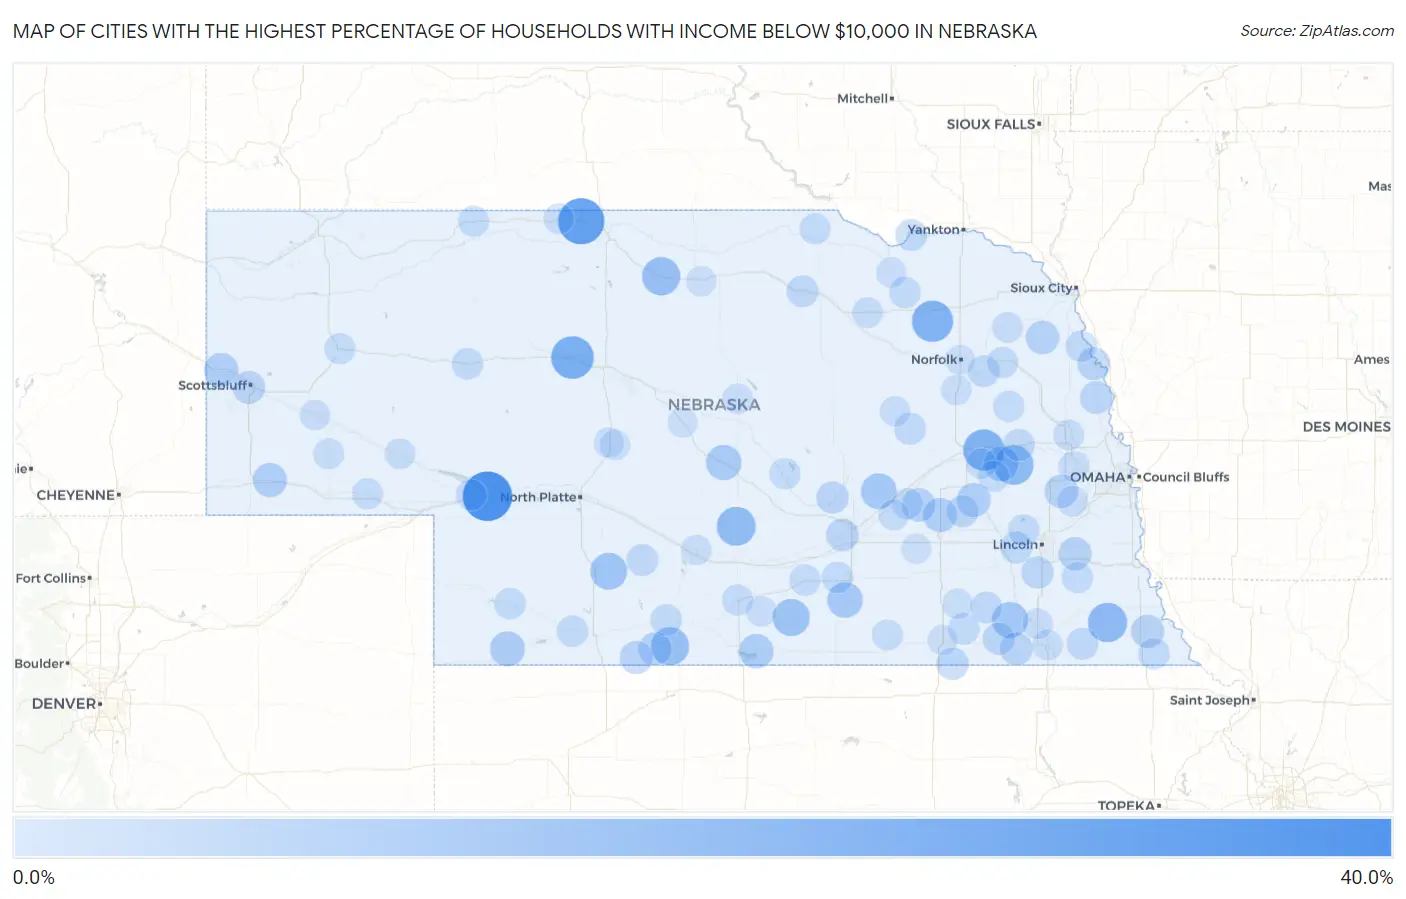
Map of Cities with the Highest Percentage of Households with Income Below $10,000 in Nebraska
0.0%
40.0%
Cities with the Highest Percentage of Households with Income Below $10,000 in Nebraska
| City | Households with Income < $10k | vs State | vs National | |
| 1. | Roscoe | 38.9% | 4.2%(+34.7)#1 | 4.9%(+34.0)#318 |
| 2. | Crookston | 33.3% | 4.2%(+29.1)#2 | 4.9%(+28.4)#456 |
| 3. | Seneca | 27.3% | 4.2%(+23.1)#3 | 4.9%(+22.4)#674 |
| 4. | Richland | 25.0% | 4.2%(+20.8)#4 | 4.9%(+20.1)#801 |
| 5. | Foster | 25.0% | 4.2%(+20.8)#5 | 4.9%(+20.1)#802 |
| 6. | Abie | 22.2% | 4.2%(+18.0)#6 | 4.9%(+17.3)#1,004 |
| 7. | Elk Creek | 21.7% | 4.2%(+17.5)#7 | 4.9%(+16.8)#1,038 |
| 8. | Miller | 21.2% | 4.2%(+17.0)#8 | 4.9%(+16.3)#1,096 |
| 9. | Hendley | 20.0% | 4.2%(+15.8)#9 | 4.9%(+15.1)#1,226 |
| 10. | Johnstown | 20.0% | 4.2%(+15.8)#10 | 4.9%(+15.1)#1,230 |
| 11. | Upland | 18.0% | 4.2%(+13.8)#11 | 4.9%(+13.1)#1,495 |
| 12. | Curtis | 17.6% | 4.2%(+13.4)#12 | 4.9%(+12.7)#1,546 |
| 13. | Plymouth | 16.4% | 4.2%(+12.2)#13 | 4.9%(+11.5)#1,793 |
| 14. | Archer | 16.1% | 4.2%(+11.9)#14 | 4.9%(+11.2)#1,857 |
| 15. | Ayr | 15.6% | 4.2%(+11.4)#15 | 4.9%(+10.7)#1,959 |
| 16. | Berwyn | 15.2% | 4.2%(+11.0)#16 | 4.9%(+10.3)#2,061 |
| 17. | Octavia | 14.8% | 4.2%(+10.6)#17 | 4.9%(+9.90)#2,165 |
| 18. | Max | 14.6% | 4.2%(+10.4)#18 | 4.9%(+9.70)#2,221 |
| 19. | Republican City | 13.8% | 4.2%(+9.60)#19 | 4.9%(+8.90)#2,443 |
| 20. | Morrill | 13.5% | 4.2%(+9.30)#20 | 4.9%(+8.60)#2,522 |
| 21. | Dix | 13.4% | 4.2%(+9.20)#21 | 4.9%(+8.50)#2,558 |
| 22. | Surprise | 13.3% | 4.2%(+9.10)#22 | 4.9%(+8.40)#2,619 |
| 23. | Benedict | 13.2% | 4.2%(+9.00)#23 | 4.9%(+8.30)#2,642 |
| 24. | Polk | 12.5% | 4.2%(+8.30)#24 | 4.9%(+7.60)#2,923 |
| 25. | Thurston | 12.5% | 4.2%(+8.30)#25 | 4.9%(+7.60)#2,936 |
| 26. | Ithaca | 12.1% | 4.2%(+7.90)#26 | 4.9%(+7.20)#3,135 |
| 27. | Wilsonville | 12.1% | 4.2%(+7.90)#27 | 4.9%(+7.20)#3,139 |
| 28. | Woodland Hills | 11.8% | 4.2%(+7.60)#28 | 4.9%(+6.90)#3,299 |
| 29. | Stella | 11.8% | 4.2%(+7.60)#29 | 4.9%(+6.90)#3,308 |
| 30. | Lebanon | 11.5% | 4.2%(+7.30)#30 | 4.9%(+6.60)#3,464 |
| 31. | Terrytown | 11.3% | 4.2%(+7.10)#31 | 4.9%(+6.40)#3,578 |
| 32. | Diller | 11.3% | 4.2%(+7.10)#32 | 4.9%(+6.40)#3,596 |
| 33. | Decatur | 11.2% | 4.2%(+7.00)#33 | 4.9%(+6.30)#3,628 |
| 34. | Tekamah | 11.0% | 4.2%(+6.80)#34 | 4.9%(+6.10)#3,721 |
| 35. | Alda | 11.0% | 4.2%(+6.80)#35 | 4.9%(+6.10)#3,744 |
| 36. | Dannebrog | 10.5% | 4.2%(+6.30)#36 | 4.9%(+5.60)#4,079 |
| 37. | Sprague | 10.4% | 4.2%(+6.20)#37 | 4.9%(+5.50)#4,134 |
| 38. | Hubbell | 10.3% | 4.2%(+6.10)#38 | 4.9%(+5.40)#4,232 |
| 39. | Gresham | 10.2% | 4.2%(+6.00)#39 | 4.9%(+5.30)#4,293 |
| 40. | Jansen | 10.2% | 4.2%(+6.00)#40 | 4.9%(+5.30)#4,297 |
| 41. | Pleasant Dale | 10.0% | 4.2%(+5.80)#41 | 4.9%(+5.10)#4,409 |
| 42. | Rogers | 10.0% | 4.2%(+5.80)#42 | 4.9%(+5.10)#4,420 |
| 43. | Emmet | 10.0% | 4.2%(+5.80)#43 | 4.9%(+5.10)#4,429 |
| 44. | Stanton | 9.9% | 4.2%(+5.70)#44 | 4.9%(+5.00)#4,459 |
| 45. | St Edward | 9.8% | 4.2%(+5.60)#45 | 4.9%(+4.90)#4,567 |
| 46. | Farnam | 9.8% | 4.2%(+5.60)#46 | 4.9%(+4.90)#4,585 |
| 47. | Burchard | 9.7% | 4.2%(+5.50)#47 | 4.9%(+4.80)#4,667 |
| 48. | Western | 9.6% | 4.2%(+5.40)#48 | 4.9%(+4.70)#4,739 |
| 49. | Santee | 9.5% | 4.2%(+5.30)#49 | 4.9%(+4.60)#4,809 |
| 50. | Juniata | 9.4% | 4.2%(+5.20)#50 | 4.9%(+4.50)#4,883 |
| 51. | Alexandria | 9.4% | 4.2%(+5.20)#51 | 4.9%(+4.50)#4,913 |
| 52. | Holbrook | 9.3% | 4.2%(+5.10)#52 | 4.9%(+4.40)#4,991 |
| 53. | Hyannis | 9.3% | 4.2%(+5.10)#53 | 4.9%(+4.40)#4,999 |
| 54. | Creighton | 9.2% | 4.2%(+5.00)#54 | 4.9%(+4.30)#5,053 |
| 55. | Macy | 9.2% | 4.2%(+5.00)#55 | 4.9%(+4.30)#5,067 |
| 56. | Culbertson | 9.2% | 4.2%(+5.00)#56 | 4.9%(+4.30)#5,069 |
| 57. | Wauneta | 9.1% | 4.2%(+4.90)#57 | 4.9%(+4.20)#5,158 |
| 58. | Salem | 9.1% | 4.2%(+4.90)#58 | 4.9%(+4.20)#5,192 |
| 59. | Malcolm | 9.0% | 4.2%(+4.80)#59 | 4.9%(+4.10)#5,292 |
| 60. | Loup City | 8.9% | 4.2%(+4.70)#60 | 4.9%(+4.00)#5,374 |
| 61. | Douglas | 8.9% | 4.2%(+4.70)#61 | 4.9%(+4.00)#5,399 |
| 62. | Heartwell | 8.9% | 4.2%(+4.70)#62 | 4.9%(+4.00)#5,407 |
| 63. | Holdrege | 8.8% | 4.2%(+4.60)#63 | 4.9%(+3.90)#5,433 |
| 64. | Howells | 8.7% | 4.2%(+4.50)#64 | 4.9%(+3.80)#5,606 |
| 65. | Ogallala | 8.6% | 4.2%(+4.40)#65 | 4.9%(+3.70)#5,671 |
| 66. | David City | 8.6% | 4.2%(+4.40)#66 | 4.9%(+3.70)#5,682 |
| 67. | Hordville | 8.6% | 4.2%(+4.40)#67 | 4.9%(+3.70)#5,733 |
| 68. | Alliance | 8.5% | 4.2%(+4.30)#68 | 4.9%(+3.60)#5,768 |
| 69. | Spencer | 8.5% | 4.2%(+4.30)#69 | 4.9%(+3.60)#5,850 |
| 70. | Pilger | 8.5% | 4.2%(+4.30)#70 | 4.9%(+3.60)#5,851 |
| 71. | Lodgepole | 8.5% | 4.2%(+4.30)#71 | 4.9%(+3.60)#5,857 |
| 72. | Merriman | 8.5% | 4.2%(+4.30)#72 | 4.9%(+3.60)#5,873 |
| 73. | Dalton | 8.4% | 4.2%(+4.20)#73 | 4.9%(+3.50)#5,963 |
| 74. | Memphis | 8.3% | 4.2%(+4.10)#74 | 4.9%(+3.40)#6,091 |
| 75. | Nickerson | 8.2% | 4.2%(+4.00)#75 | 4.9%(+3.30)#6,174 |
| 76. | Nelson | 8.2% | 4.2%(+4.00)#76 | 4.9%(+3.30)#6,179 |
| 77. | Wayne | 8.1% | 4.2%(+3.90)#77 | 4.9%(+3.20)#6,230 |
| 78. | Orchard | 8.1% | 4.2%(+3.90)#78 | 4.9%(+3.20)#6,300 |
| 79. | Oshkosh | 8.0% | 4.2%(+3.80)#79 | 4.9%(+3.10)#6,380 |
| 80. | Blue Springs | 8.0% | 4.2%(+3.80)#80 | 4.9%(+3.10)#6,427 |
| 81. | Bellwood | 7.9% | 4.2%(+3.70)#81 | 4.9%(+3.00)#6,547 |
| 82. | Marquette | 7.9% | 4.2%(+3.70)#82 | 4.9%(+3.00)#6,566 |
| 83. | Kilgore | 7.9% | 4.2%(+3.70)#83 | 4.9%(+3.00)#6,575 |
| 84. | Beatrice | 7.8% | 4.2%(+3.60)#84 | 4.9%(+2.90)#6,594 |
| 85. | Madison | 7.8% | 4.2%(+3.60)#85 | 4.9%(+2.90)#6,623 |
| 86. | Albion | 7.8% | 4.2%(+3.60)#86 | 4.9%(+2.90)#6,632 |
| 87. | Taylor | 7.8% | 4.2%(+3.60)#87 | 4.9%(+2.90)#6,692 |
| 88. | Gandy | 7.7% | 4.2%(+3.50)#88 | 4.9%(+2.80)#6,843 |
| 89. | Verdigre | 7.6% | 4.2%(+3.40)#89 | 4.9%(+2.70)#6,953 |
| 90. | Wilcox | 7.6% | 4.2%(+3.40)#90 | 4.9%(+2.70)#6,966 |
| 91. | Lexington | 7.5% | 4.2%(+3.30)#91 | 4.9%(+2.60)#7,018 |
| 92. | Bridgeport | 7.5% | 4.2%(+3.30)#92 | 4.9%(+2.60)#7,077 |
| 93. | Leshara | 7.4% | 4.2%(+3.20)#93 | 4.9%(+2.50)#7,279 |
| 94. | Ohiowa | 7.4% | 4.2%(+3.20)#94 | 4.9%(+2.50)#7,285 |
| 95. | Henderson | 7.3% | 4.2%(+3.10)#95 | 4.9%(+2.40)#7,374 |
| 96. | Anselmo | 7.3% | 4.2%(+3.10)#96 | 4.9%(+2.40)#7,429 |
| 97. | Norfolk | 7.2% | 4.2%(+3.00)#97 | 4.9%(+2.30)#7,446 |
| 98. | Hebron | 7.2% | 4.2%(+3.00)#98 | 4.9%(+2.30)#7,518 |
| 99. | Long Pine | 7.2% | 4.2%(+3.00)#99 | 4.9%(+2.30)#7,580 |
| 100. | Stapleton | 7.1% | 4.2%(+2.90)#100 | 4.9%(+2.20)#7,708 |
Common Questions
What are the Top 10 Cities with the Highest Percentage of Households with Income Below $10,000 in Nebraska?
Top 10 Cities with the Highest Percentage of Households with Income Below $10,000 in Nebraska are:
What city has the Highest Percentage of Households with Income Below $10,000 in Nebraska?
Roscoe has the Highest Percentage of Households with Income Below $10,000 in Nebraska with 38.9%.
What is the Percentage of Households with Income Below $10,000 in the State of Nebraska?
Percentage of Households with Income Below $10,000 in Nebraska is 4.2%.
What is the Percentage of Households with Income Below $10,000 in the United States?
Percentage of Households with Income Below $10,000 in the United States is 4.9%.