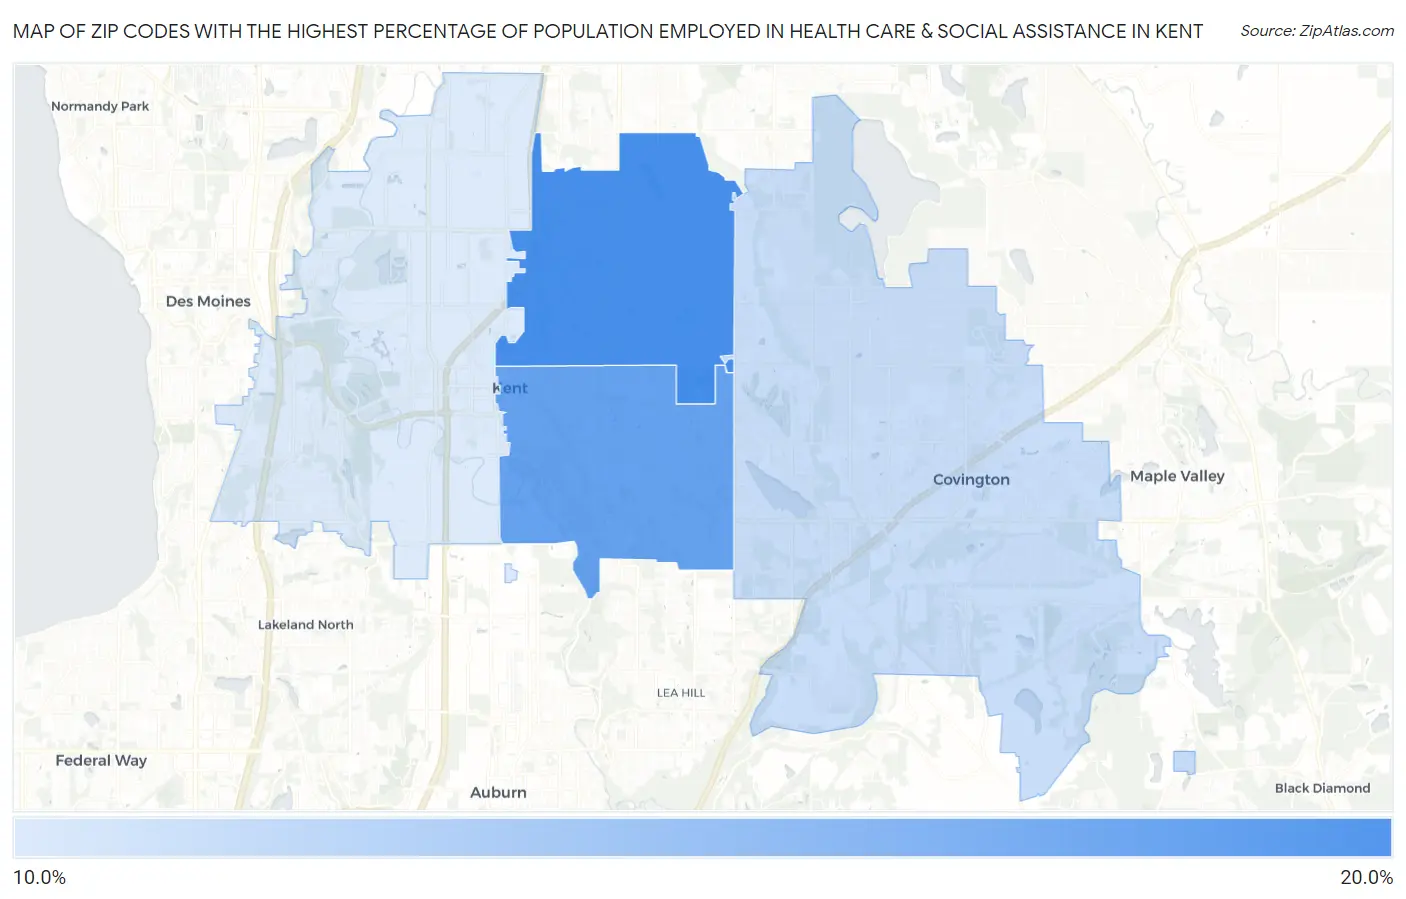
Zip Codes with the Highest Percentage of Population Employed in Health Care & Social Assistance in Kent, WA
RELATED REPORTS & OPTIONS
Health Care & Social Assistance
Kent
Compare Zip Codes
Map of Zip Codes with the Highest Percentage of Population Employed in Health Care & Social Assistance in Kent
11.0%
16.5%
Zip Codes with the Highest Percentage of Population Employed in Health Care & Social Assistance in Kent, WA
| Zip Code | % Employed | vs State | vs National | |
| 1. | 98031 | 16.5% | 13.0%(+3.44)#95 | 13.9%(+2.54)#8,604 |
| 2. | 98030 | 15.4% | 13.0%(+2.36)#131 | 13.9%(+1.46)#10,738 |
| 3. | 98042 | 11.8% | 13.0%(-1.25)#300 | 13.9%(-2.15)#19,492 |
| 4. | 98032 | 11.0% | 13.0%(-2.03)#343 | 13.9%(-2.93)#21,339 |
1
Common Questions
What are the Top 3 Zip Codes with the Highest Percentage of Population Employed in Health Care & Social Assistance in Kent, WA?
Top 3 Zip Codes with the Highest Percentage of Population Employed in Health Care & Social Assistance in Kent, WA are:
What zip code has the Highest Percentage of Population Employed in Health Care & Social Assistance in Kent, WA?
98031 has the Highest Percentage of Population Employed in Health Care & Social Assistance in Kent, WA with 16.5%.
What is the Percentage of Population Employed in Health Care & Social Assistance in Kent, WA?
Percentage of Population Employed in Health Care & Social Assistance in Kent is 14.1%.
What is the Percentage of Population Employed in Health Care & Social Assistance in Washington?
Percentage of Population Employed in Health Care & Social Assistance in Washington is 13.0%.
What is the Percentage of Population Employed in Health Care & Social Assistance in the United States?
Percentage of Population Employed in Health Care & Social Assistance in the United States is 13.9%.